|
The Laboratory for Computational Science & Engineering (LCSE)
High Performance Computing research in the LCSE has been focused since the lab's founding in 1995 on the SMP cluster architecture, with which LCSE researchers did pioneering work with Silicon Graphics in 1993.


Associated Movies 
Movie of vorticity magnitude in a K-cubed turbulence run done at LANL a few years later under the ASCI program. I believe this movie was made by Sarah Anderson. Any movies of the original run at SGI have been lost. But they made a promotional video and distributed it widely. Download: mp4

Movie of vorticity magnitude in a study of sabot discard in 2D. This was a tour de force by Kevin Edgar. Two simulations, one at double the linear grid resolution of the other (guess which is which!) are juxtaposed in this movie. There is a very long and interesting story about this study. Ask Kevin. Or perhaps ask Paul instead. There are two movies. One is density and one is vorticity magnitude. Guess which is which. Download: mp4 Download: mp4

Movie of temperature perturbations, I think, in our first simulation of penetrative convection, run by David Porter. This was run in 1994 with our regular allotment of 6 hours per week on the Cray machine at the Pittsburgh Supercomputer Center. The grid resolution was 512**3, and this ran for a full year. Our Sun workstation was in the Westinghouse machine room, with an exabyte tape recorder attached. The folks at PSC agreed to send us one tape a week. David excelled with his cinematography with this one. Download: mp4

David Porter's most famous movie of his red giant star simulation carried out at NCSA on their Silicon Graphics machines in the late 1990s is in Apple's quicktime, and I could not convert it to mp4 format. So I converted this movie instead. I believe he made it for an exhibition at the Hayden Planetarium in New York a few years later that was focused on the sun. He changed the colors, because they wanted it to look more like we all know the sun looks. I could be wrong. It was quite a while ago. Oh, I found a second movie made from the 1024**3 calculation we started from the 512**3 one that is still in quicktime format and unconvertible. Back then, even with a year's allocation, we could not run this star very far in time at 1024**3 resolution. Now, you could almost do that on a laptop machine. This simulation was the discovery calculation of the dipole circulation pattern in core convection. It took about 5 years for the community to accept it, because 1-D thinking about stars was so prevalent at that time. Download: mp4 Download: mp4

This is a very famous movie, visualized by Sarah Anderson in 1999. We call it our broccoli movie. It is in avi format and I could not convert it to mp4, so you need to download it to see it. (Well, after all Tom Ruwart figured out how to convert it, but the avi version is always better.) The simulation of the Richtmyer-Meshkov instability in an experiment carried out at Caltech was suggested to us by our Lawrence Livermore Lab collaborators. It was a constraint that we carry out the simulation using our simplified code sPPM, because that code was used in the ASCI procurements that ended up purchasing two very large computing systems -- a Silicon Graphics system at LANL and an IBM system at Livermore. This calculation was done on the IBM system. This was the first calculation of its type to run at one teraflop/s in 32-bit precision, a determination that required lawyers to settle the official definition of the flop. This work won the Gordon Bell Award in 1999, and news of the run was announced by Vice President Al Gore in the rose garden of the white house (David and I were not invited). It was also the first simulation with sufficient grid resolution to permit analysis of the data to be carried out without constant questioning whether the results obtained were or were not caused by numerical effects. This allowed us to discover, for the first time, that the forward transfer of turbulent energy from larger to smaller scales happens where the sign of the determinant of the deviatoric symmetric strain rate tensor (David, do I have that right?) signifies a local flow that is compressing in one dimension and expanding in the other two. This discovery unlocked the modeling of fluid turbulence, according to me at least. Using this flow and a later 2048**3 Mach-1 turbulence decay simulation, David Porter and I (more him than me) came up with a turbulence model. That was a great achievement. But we also found that modeling the turbulence the way people on the West coast had been saying for years one must do is simply not necessary. In a real time-dependent fluid flow simulation, it turns out to be a detail. So we never used our turbulence model, although it is a great one (and, I expect, the first correct one). This sort of outcome is just life in the research business. Download: avi Download: mp4

This is our 2048**3 turbulence decay simulation, which starts at Mach 1. We ran this on the first cluster of nodes incorporating Intel's itanium CPUs, which were built for exclusively 64-bit computation. The cluster was built at NCSA, and Rob Pennington, a friend from his earlier days working in Minnesota for Roberta, and the winner of the ETA liquidation auction sweepstakes, attached 8 special nodes to the cluster that had striped, very fast disk systems. We modified the PPM algorithm to be highly latency tolerant, and we ran the calculation for weeks on the system, as they were building it, from a continuously updated image on the disks. This computation was resilient, as we demonstrated in the NCSA exhibit booth at Supercomputing that year in Denver (2003?). This marked the end of our turbulence runs. We used it to validate the turbulence model we formulated from the Richtmyer-Meshkiov simulation, and then we simply could not see any valid scientific case for doing bigger homogeneous turbulence runs. This was visualized by me, PRW, and that was a challenge. We suggested that a summer student should visualize it as his project, and he simply quit more or less on the spot. See if you agree. Making it clear what this simulation shows was not easy. But you can see it right away in this rendering, can't you? We sent all 3 TB of the data from this run dutifully to the San Diego Supercomputer Center, because NSF had designated them as the storage node for the country. Weeks later, in bringing back data, David Porter discovered that the data was disappearing. Happily, we had sent all the BoB files used to make this movie and a small set of detailed files to ourselves in Minnesota. All our data was deleted at San Diego, because they ran out of tape and felt that we would never read it anyway. The director of that center later came and gave a talk about how great they were -- give us all your data, and exhortations like that. After her talk, I went up and pointed out that they had deleted all our data rather than buy new tape cartridges. She said someone had left who was involved in that. But it was not that "heads had rolled," as I thought they should have, but that they had simply left. So much for the data storage center for the nation. People are better at storing your data these days, but this must have been back when tape was really expensive. Download: mp4

This calculation, and especially its visualization, was carried out by Tony Nowatzki, if I remember correctly. Around the time that David Porter and I were developing our turbulence model, the LCSE had a partnership with the local computing company Unisys (see the State Fair demo shown further down). Unisys gave us an ES-7000 machine, a very powerful Windows SMP. We did a number of studies with it, and this was one. The work resulted in our complete restructuring of our PPM code, a restructuring that produced enormous gains as multicore CPUs later came into play, beginning with the CELL processor. For our turbulence model, we needed to know what happens when a shock travels through a turbulent fluid. There had been theories on this, as I remember, and we found that none of them were correct. The way we found out was this calculation. We took our periodic box of turbulence in one of its 10 saved states that David had rescued from the San Diego Center before it wrote over them with other people's data (which no doubt it soon overwrote with still other people's data -- tape was so expensive in those days) and we put 8 of these boxes in a line. That makes an awfully big grid, but we probably averaged it down to a manageable size. Then we simply added an x-component of velocity that was constant in each set of 4 boxes, so that they crashed into each other at something like Mach 4. The result is shown here with Tony Nowatzki's superb cinematography, executed no doubt using the LCSE Discover movie making tool that he built, with some help I believe from Jim Greensky. LCSE Discover was written in C#, befitting a Windows advocate. Tony went through the code with me before he left for graduate school, and I thought I could modify the code if absolutely necessary. However, we never touched it. Used it for at least 10 years, towards the end running it in a virtual box. It stands as a concrete lesson to students: if you want your work to benefit the lab after you leave, complete it and test it and make sure it works. Download: mp4

During the early years of this century, the LCSE had a partnership with NCSA as an NSF-supported MetaCenter Regional Alliance, or maybe as something else. I was on the NCSA executive committee, and we didn't execute very much, but we did meet periodically, which was always fun. Somehow Larry Smarr managed to give the impression that we regional partners ought to find some way to enhance the work of the mother ship, quite a reasonable idea if you think about it. I chose to work with Bob Wilhelmson, a lovely person who had invented a numerical scheme based upon making the sound speed artificially low in order to enable explicit computation. He explained it to me once, I did not really get it, but I felt that I would be diminished in his view if I asked him to elaborate further. Anyway, we were two explicit people doing fluid dynamics -- gas dynamics even -- so he was obviously the person to go to. We decided that our lab could help him by showing him the benefits of volume visualization. He gave us his code, and David Porter set it up to simulate a thunderstorm over a perfectly smooth plane. He then visualized the result, which you can see in the movie. Wilhelmson would never admit that this run developed a tornado, but it did. The reason, which became clear only years later, was that David, of course, used a uniform grid. Later Leigh Orf fully embraced volume visualization and also the uniform grid, and as they say, the rest is history. But I remember that a key point was that I told Leigh some very important tricks of volume visualization relating to color and opacity maps. David Yuen had not realized these things either. Our team had, back before 1990, realized that to get the proper 3-D visual cues, you have to have motion -- of either the subject or the camera -- and you must exploit limb brightening or darkening, an effect beloved of astronomers. So check out this thunderstorm video. Would you have changed your ways after seeing it? That experiment has been performed. Download: mp4

This simulation marks a high point in the LCSE colaboration with Unisys. In the summer of 2003, we found ourselves with relatively little to do, and Unisys had given us a 32-processor machine with lots of spigots for disks and visualization gear. They were going to host an exhibit booth at the State Fair, not far from the lab, in a section of the fair billed as the "Wonders of Technology." So we decided, what the hell, why not chip in. I had somewhat recently, I can't remember why, developed an enhancement of our PPM hydrodynamics code to track multiple fluids. (Oh, now I remember. Wenlong Dai and I had worked on building a PPB-like hydro scheme for my DoE grant, and we had made the amazing discovery that this scheme was, quite literally, too good. It was so good that it revealed the inconsistencies in directionally split hydrodynamics. We found in that study that PPM was right on the edge. It was, essentially, the most accurate that you could be and still be directionally split. Wow. I told the DoE about it in my final report, and that was the end of that. But PPB we knew very well was not too good for directionally split advection. So I built this state-fair demo code to test PPB advection in combination with PPM hydro. What a winning combination that turned out to be.) I used this later for thunderstorms as an NCSA partner, tracking air, cloud water vapor, rain, and hail. But we decided to track 3 fluids: r, g, and b. The idea was that the ES-7000 was so powerful that it would simply blow you away. And it was powerful. So powerful, in fact, that it made real-time 2-D hydro with immediate visualization possible. We decided that we could take a picture of a person, convert it to a bit-map, and then use the intensity levels of r, g, and b to tell us the volume fractions of r, g, and b gases. We assigned density to r, g, and b in some proportions that I do not remember. Then we established at the left-hand boundary of a rectangular Cartesian domain with a flow-out boundary at the right, an incoming flow at Mach 5, or maybe Mach 3, whatever. We encouraged visitors to the booth to have their photos taken and to be subsequently blown away by the latest Unisys technology. To get things started, various Unisys executives volunteered to be photographed, as did various University potentates, and we blew them away on the ES-7000 at high resolution. I know that I saved the movies somewhere, but these were not movies we were playing a lot for visitors. I have used the saved images -- every 50th one -- from a particular movie to make the animation you can see below. Enjoy. This is a technology that I offered to Wilhelmson at NCSA, to people at Los Alamos, and to my present collaborator, Falk Herwig, in Victoria. It has been simply a raging success, but then you be the judge. Download: mp4

I have multiple movies to choose from here. The one you get below is called "phlin.mp4," so it must be appropriate. This movie commemorates our Roadrunner experience. That was really something. It all began with Karl-Heinz Winkler coming up with the idea of buying (for 100 million dolars, no less) a supercomputer based on the IBM CELL processor, the invention of Peter Hofstee. This was a very advanced technology for the time, and I volunteered, no doubt for some sort of consideration through some sort of standard vehicle, to do everything I could to make it look good. I had two computer science graduate students at that time -- Pei-Hung Lin and Jagan Howe -- and I decided to completely rewrite my PPM code to exploit this machine -- called Roadrunner -- and to address a suitably weighty official DoE problem. We went after the development of Rayleigh-Taylor instability, beginning only with very small-scale disturbances, well into the presumably self-similar asymptotic regime. We figured that Roadrunner would give us the computational umpf that this required. It did. The story of this Roadrunner code is long and complicated. Let's not go into it. Personally, I spent years looking at visualizations of Rayleigh-Taylor flows, trying to come up with some simplified way of understanding them. I failed. This video, I think, represents some of Mike Knox's exceptional work in visualizing the unvisualizable. Well, there were other videos too, and maybe this is not the best one. But you will get the picture. The Roadrunner machine was a transformative event in scientific computation -- my opinion. After Roadrunner, it simply was not the same. Was it better? It was certainly more complicated. Kind of like this flow. We did ultimately measure the coefficient in the self-similar regime, and it was not the value anyone thought it should be. And kind of like that turbulence model, now, many years later, it is the most probable outcome that it simply does not matter what the damned coefficient is, was, or should be. Life in research. Get used to it. Download: mp4

Everything about this calculation was/is incredible. It is my modification of an official DoE test problem that I call TP3, invented by David Youngs. It is a dramatic simplification of the problem of the implosion of a laser-fusion pellet. There is only hydro. Only gamma-law gases with gamma = 5/3 (I think). I modified it to have a perfectly spherical outer boundary condition of pushing inward, but I also modified Youngs' version by eliminating his cheating in the central regions. Everything that at least I knew going into this was that the biggest possible grid has to be required. This, in a way, is my very belated response to "the challenge on the napkin." At the end of my consultancy at Livermore in about 1994 or earlier, I forget precisely when, before leaving I went to the guy in the corner office and asked him what it would take for him to listen to me, broadly speaking. He went to the board and told me that I would have to use my Eulerian technology to implode a spherical pellet by a factor of 40, or was it 50, in radius while producing only those changes caused by just two -- count them, two -- perfectly sinusoidal perturbations on the original surface. He knew it was impossible, and so did I. That was the point. He would never listen to me. So what; after all I was quitting. But over the Christmas vacation of 2011, I did the impossible, which was this calculation. What did it take? Over a trillion grid cells on a smoothly imploding uniform Cartesian grid. PPB multifluid advection with PPM hydro -- the real thing, with that crazy multi-D shock dissipation thingy described in the original paper that probably no one ever coded up but me. This computation was done on all of the Blue Waters system over 4 days. They told me that they could see it on the power meters that showed the electricity usage -- $35,000 per day just for the electricity. I think we did only 35,000 time steps or so, in any case not so many. And we only made something like 40 data dumps, so smooth movies of the time development are not possible. But we wrote the data out to disk at 114 GB/sec, which apparently was unprecedented at the time. Mike Knox set up a way to visualize these humongous BoB files, or directories of files, remotely, and that was truly marvellous, but it was too fancy for me to run from my living room, and it was the Christmas holiday. David Porter modified the volume renderer to read only the pieces of the problem that were needed for the visualization, which sped things up enormously for views of the far hemisphere with decent opacity settings. I remember that if I started transferring the BoB files I needed directly after they were written in Illinois, I would have 45 minutes until the next dump. Just about enough time to get them to the lab and render the image, and of course send it to my laptop in my living room. I do remember Teddy coming by my chair in the living room and suggesting that this could be the capstone of my career. No way. I had plans for plenty more. Well, was he right? No computation I have ever done since has been so impossibly free of numerical artifacts. And this started with just two spherical harmonics, with an equatorial beat frequency of 3. And I followed a remark made by Candace Joggerst that I should just insert some tiny perturbation to the unstable outer shell surface just to give the numerical method something to do. That was brilliant. Numerical treatment of the real perturbation, even only in the 6th or 7th digit at the start, completely distracted the scheme from any predilection to introduce glitches and such beloved of those who refuse to believe computations. So this computation was simply a landmark, at least from my perspective. In my opinion it is a demonstration that if you are incredibly rich, and if you really want, you can accurately simulate almost anything. A lesson worth learning. The movie associated here was made by Mike Knox. Once again he has succeeded in conveying the incredibleness of this simulation, while all others who attempted it had failed, myself included. He made a series of images rendered for the Los Almos PowerWall theater, and I talked about them over a two-hour session while rapt onlookers watched in wonder. I particularly remember Bob Kares zooming in on the little chandelier at the top, and people thinking (I'm sure they were thinking it) "oh, there's a numerical effect at last in all of this!" But IT WAS NOT A NUMERICAL EFFECT. Two spherical harmonics only, and they both had "bald spots" at the top that focused sound waves. The chandelier was real. You would just never believe it. So, enjoy this visual tour, courtesy of Mike Knox, master visualizer. Our code, a graduate of Roadrunner, was one of only 4 to run on Blue Waters at over one petaflop/s, a Blue Waters contractual requirement. I don't remember how fast this particular thing ran, and, you might well say, why would I care. That was not the point. Download: mp4

This is the simulation of the Low-Z AGB star's hydrogen ingestion flash. This was carried out on the Blue Waters machine in Illinois by Stou Sandalski while I was visiting George Lake & co. at the University of Zurich. NCSA indulged us by letting us use 17000 nodes of the 26000 nodes in the machine for 4 straight days to do this run. I remember about 2 days in, when the thing seemed to just keep going and going without doing the stuff we were waiting for. I contacted Stou, and we discussed the situation. We determined that he had misread the name of one of my logical flags, and he had turned off the nuclear burning of the ingested hydrogen. That explained a lot. He quickly turned it on, and things began almost immediately to happen. The practiced eye can see in the movie precisely when Stou turned the nuclear burning on. This was just a wonderful run. The following spring, Falk Herwig and I both attended a meeting in Germany at the famous castle in Bavaria that I had heard about for years and years but had never visited. Before the meeting, after converging at the Munich airport and renting a car jointly that was appropriate for our status, we decided what to say about this run. In my memory, my talk went very smoothly. There might even be a video of it further down on this Web page. There certainly are videos, even in stereo. This was in 2016, a few years into my long collaboration with Falk Herwig. At the castle, a German scientist came over at one point and warned me about one candidate for the upcoming election. Hmmm. Download: mp4

Now we are getting into recent history. I chose this as the best simulation to represent Huaqing Mao's thesis work in the LCSE. It is the 25 solar mass star model near the beginning of the main sequence that Falk Herwig has been fixated on for many years (and all the rest of us with him). Why 25 solar masses? Well, luminosity on the main sequence scales roughly with the cube of the mass, so this would be a very luminous star. We bumped up the luminosity by a factor of 1000 anyway, to get the convection Mach number up by a factor of 10 and into the comfortable range for our explicit code. This particular simulation had a very fine grid, as you can easily see from the movie. We ran it on Frontera, the successor of Blue Waters in the NSF program. This was our best simulation of this star, but not our longest or even, perhaps, our most studied. Huaqing had added radiation pressure to the equation of state and also he added heat conduction by radiation diffusion. That second addition turned out to be critical in bringing the rate of ingestion of material from above the convection zone to a gradual stop. Huaqing's thesis addressed the vexing question of whether the ingestion ever stops. We saw that we could get our code's measurement of the ingestion rate to converge, but seeing it stop after sufficient time was another matter. Huaqing figured this out, and he came up with a way to predict where the ultimate convective boundary would be located. That is essential for knowing how long the star will remain on the main sequence. This was an extremely difficult problem. In that ICF implosion, tiny initial perturbations are responsible for the ultimate behavior, but in this problem the tiny effects do not exponentiate. They just stay tiny, and slowly get tinier. Totally different. Much harder to get right. We sent a still from this movie to NSF for their "outcomes" report on the grant. If you look, knowing what to look for (just read the thesis), you can see the mechanism that brings the ingestion to a close. With enough time and effort, I guess you can simulate anything. And if you can simulate it, you might be able to understand it. Download: mp4

Now we see that 25 solar mass star rotating. The solid body rotation velocity of the coordinate system is just sqrt(10) = 3.1623 times the average convective velocity in the core convection zone at the radius of the top of the convection zone in this stellar model. This run shows the mechanism by which the convection interacts with the rotation to generate a prograde equatorial jet, as is seen in the sun and in Jupiter and Saturn. This movie, masterfully generated by Ben McDermott, shows the similarity to Jupiter best. Other movies, which I showed when I talked on this at TACC in the summer of 2023, bring out the interaction of the convection with the internal gravity waves (IGWs). That interaction is unmistakable as the fluid flows become established. This run, performed on Frontera at scale, is a part of a wider study that I still am working to write up. So you can see that we are getting really recent here. 2023. Only a moment ago. Download: mp4

Tired of that 25 solar mass star yet? We will never tire of it. Here it is again, but now we see more of it. This was our first full-star run (M424a), made in the winter of 2024. The luminosity is increased by only 100 times, rather than our usual 1000 times, to allow everything to work out in the very outer parts. The grid is still uniform Cartesian. That's OK, because we now know that the core convection zone is adequately resolved, and the real interest of this simulation is what goes on between the inner and the outer convection zones. We observe the star's luminosity as a function of time, and of course it is so distant that we cannot see it as more than a single point of light. This type of simulation, and Falk's student Praneet Pathak has since done several more, as we have also, allows us to assess how all the various signals propagating inside this star affect the total luminosity at its surface as a function of time. Huaqing just built into the code a way to compute that, so that we observe our star as we simulate it. This movie shows the magnitude of the horizontal component of velocity, the component tangent to the sphere at its radius, which makes the internal gravity waves stand out most clearly. You can directly observe the interaction of the waves that are excited by the convection near the surface and by the convection in the core. We, of course, cannot see all that interior dynamics; we only see the total light at the surface. So, what do you think? Does the central region contribute substantially? That is not as clear as it might seem. We still argue about it. Download: mp4
A Recent Large PPMstar Simulation
An Initial Study of the Hydrogen Ingestion Flash Over the weekend of October 25-28, 2019, our research team, consisting of Paul Woodward and Huaqing Mao at the LCSE in Minnesota and Falk Herwig and Ondrea Clarkson at the University of Victoria, was given the opportunity to perform a large computation using the entire Frontera machine at TACC. This was a special opportunity with only a limited time during which we were able to prepare to make the best use of this new and very powerful machine. We therefore chose to use the most robust and well-tested version of our PPMstar code, which we knew to perform well on Frontera and to scale well on other large systems, such as Blue Waters, in Illinois, and Niagara, in Toronto. During a practice session using a quarter of the Frontera machine on the weekend before this opportunity, we were able to establish the ability of this robust code version to scale well on Frontera.
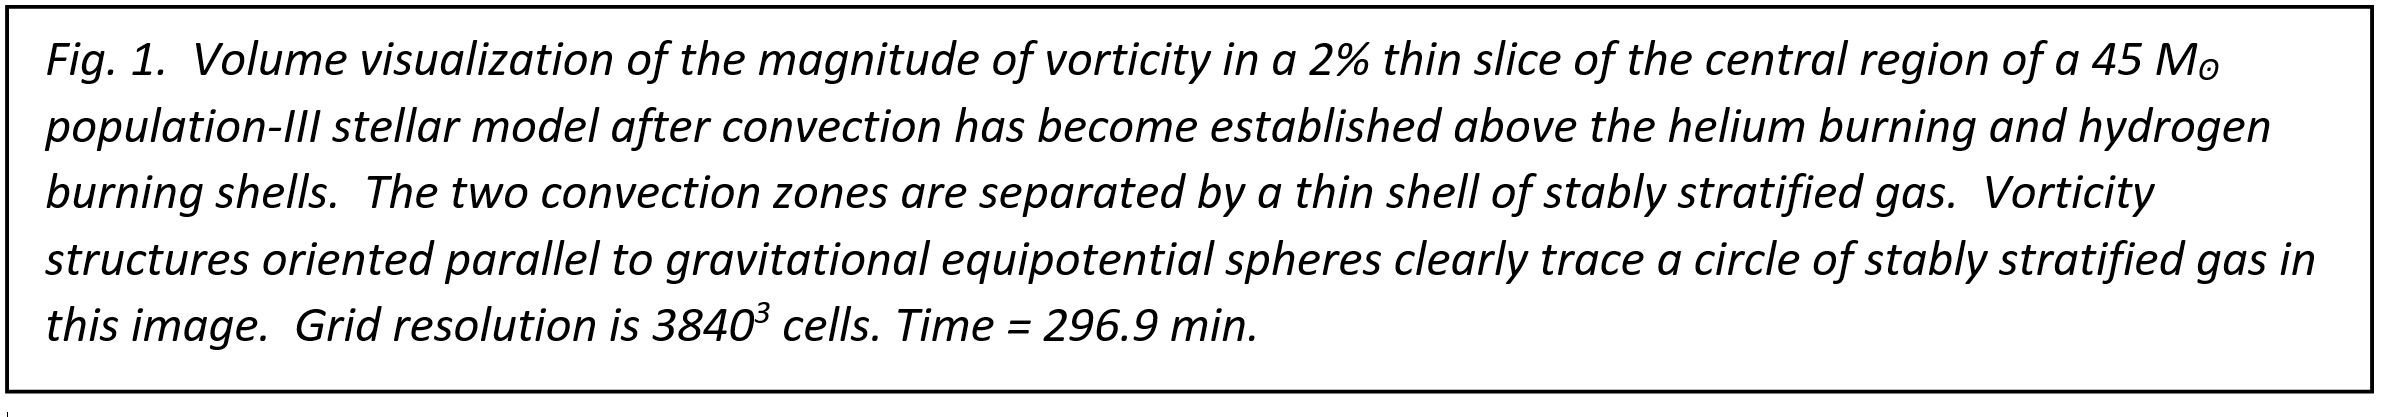
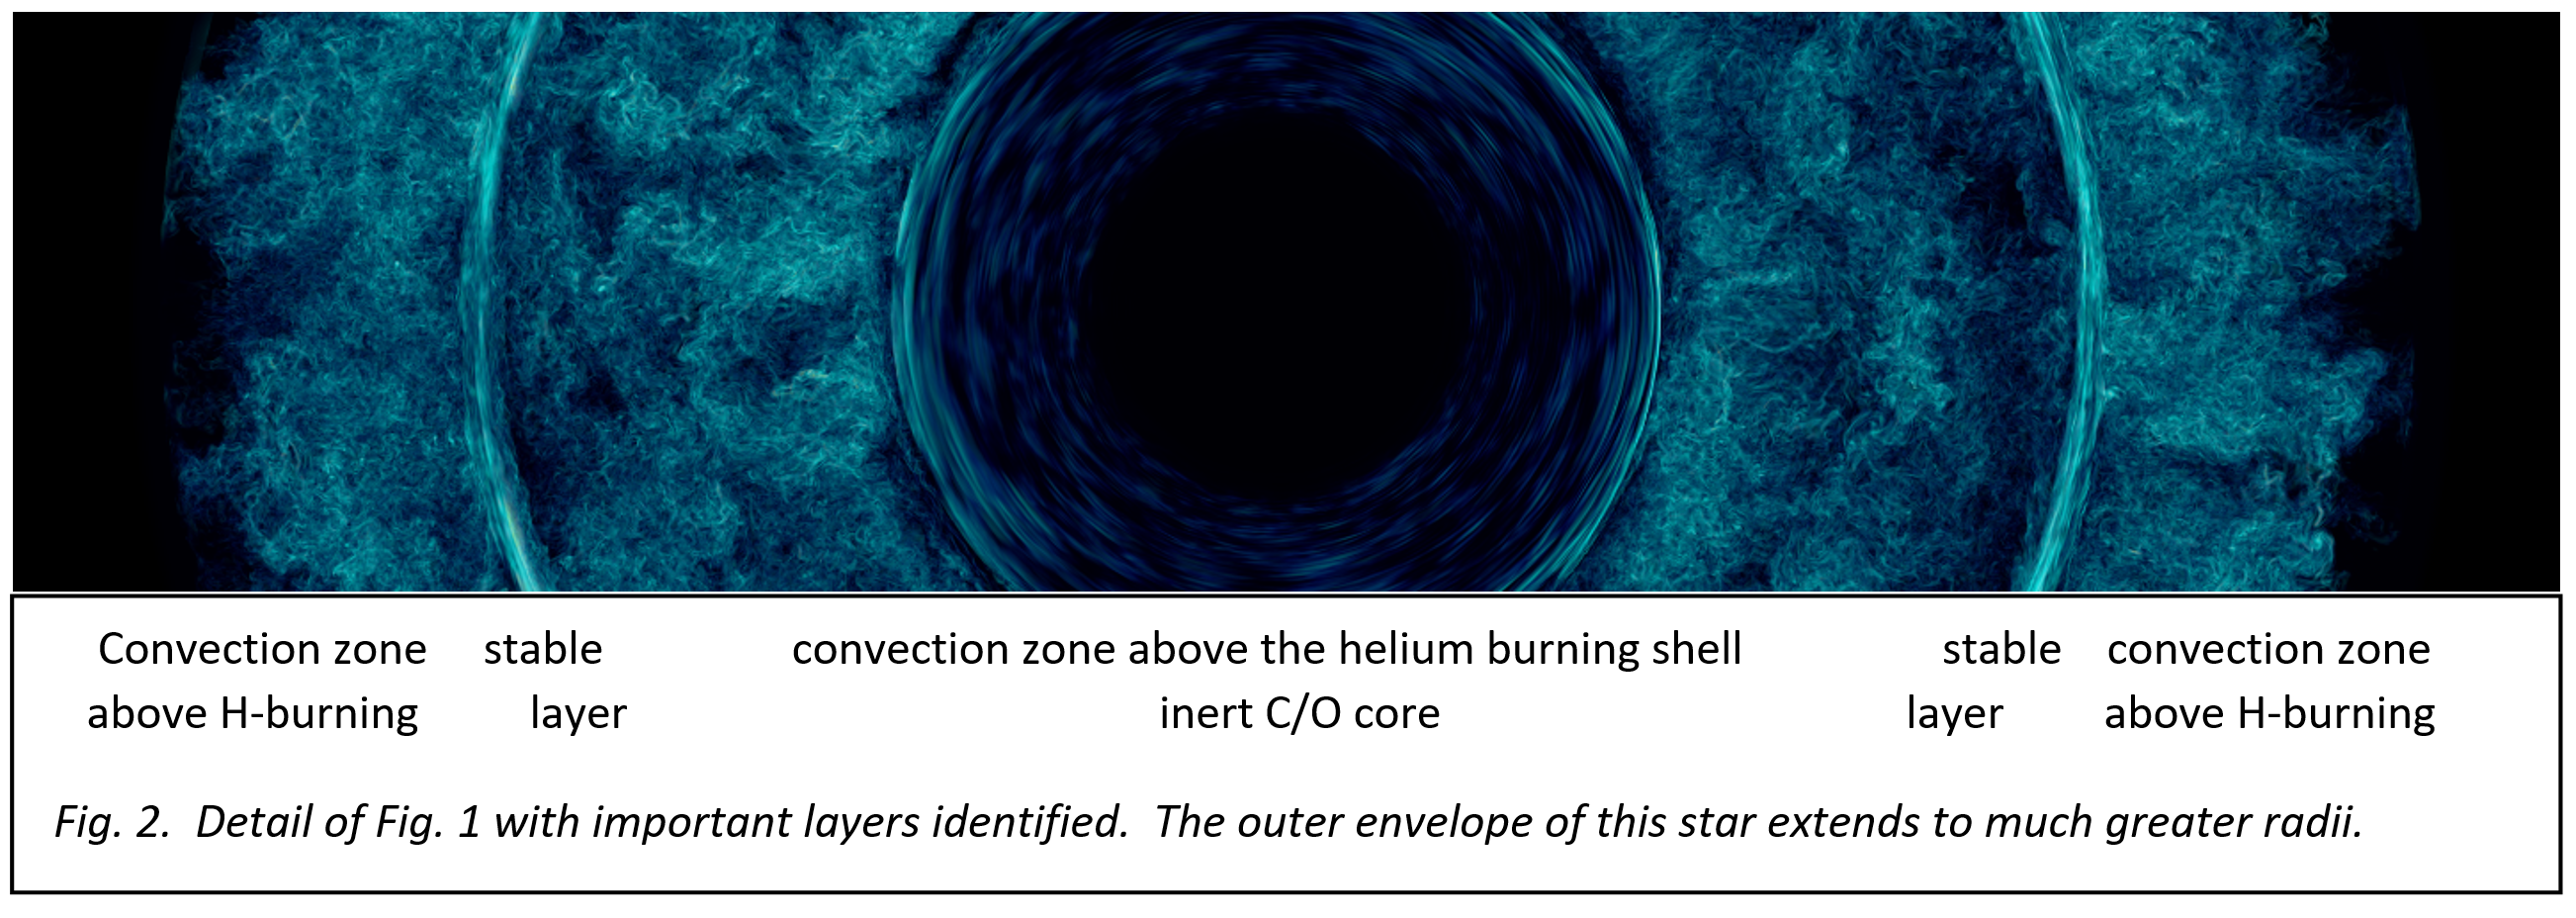
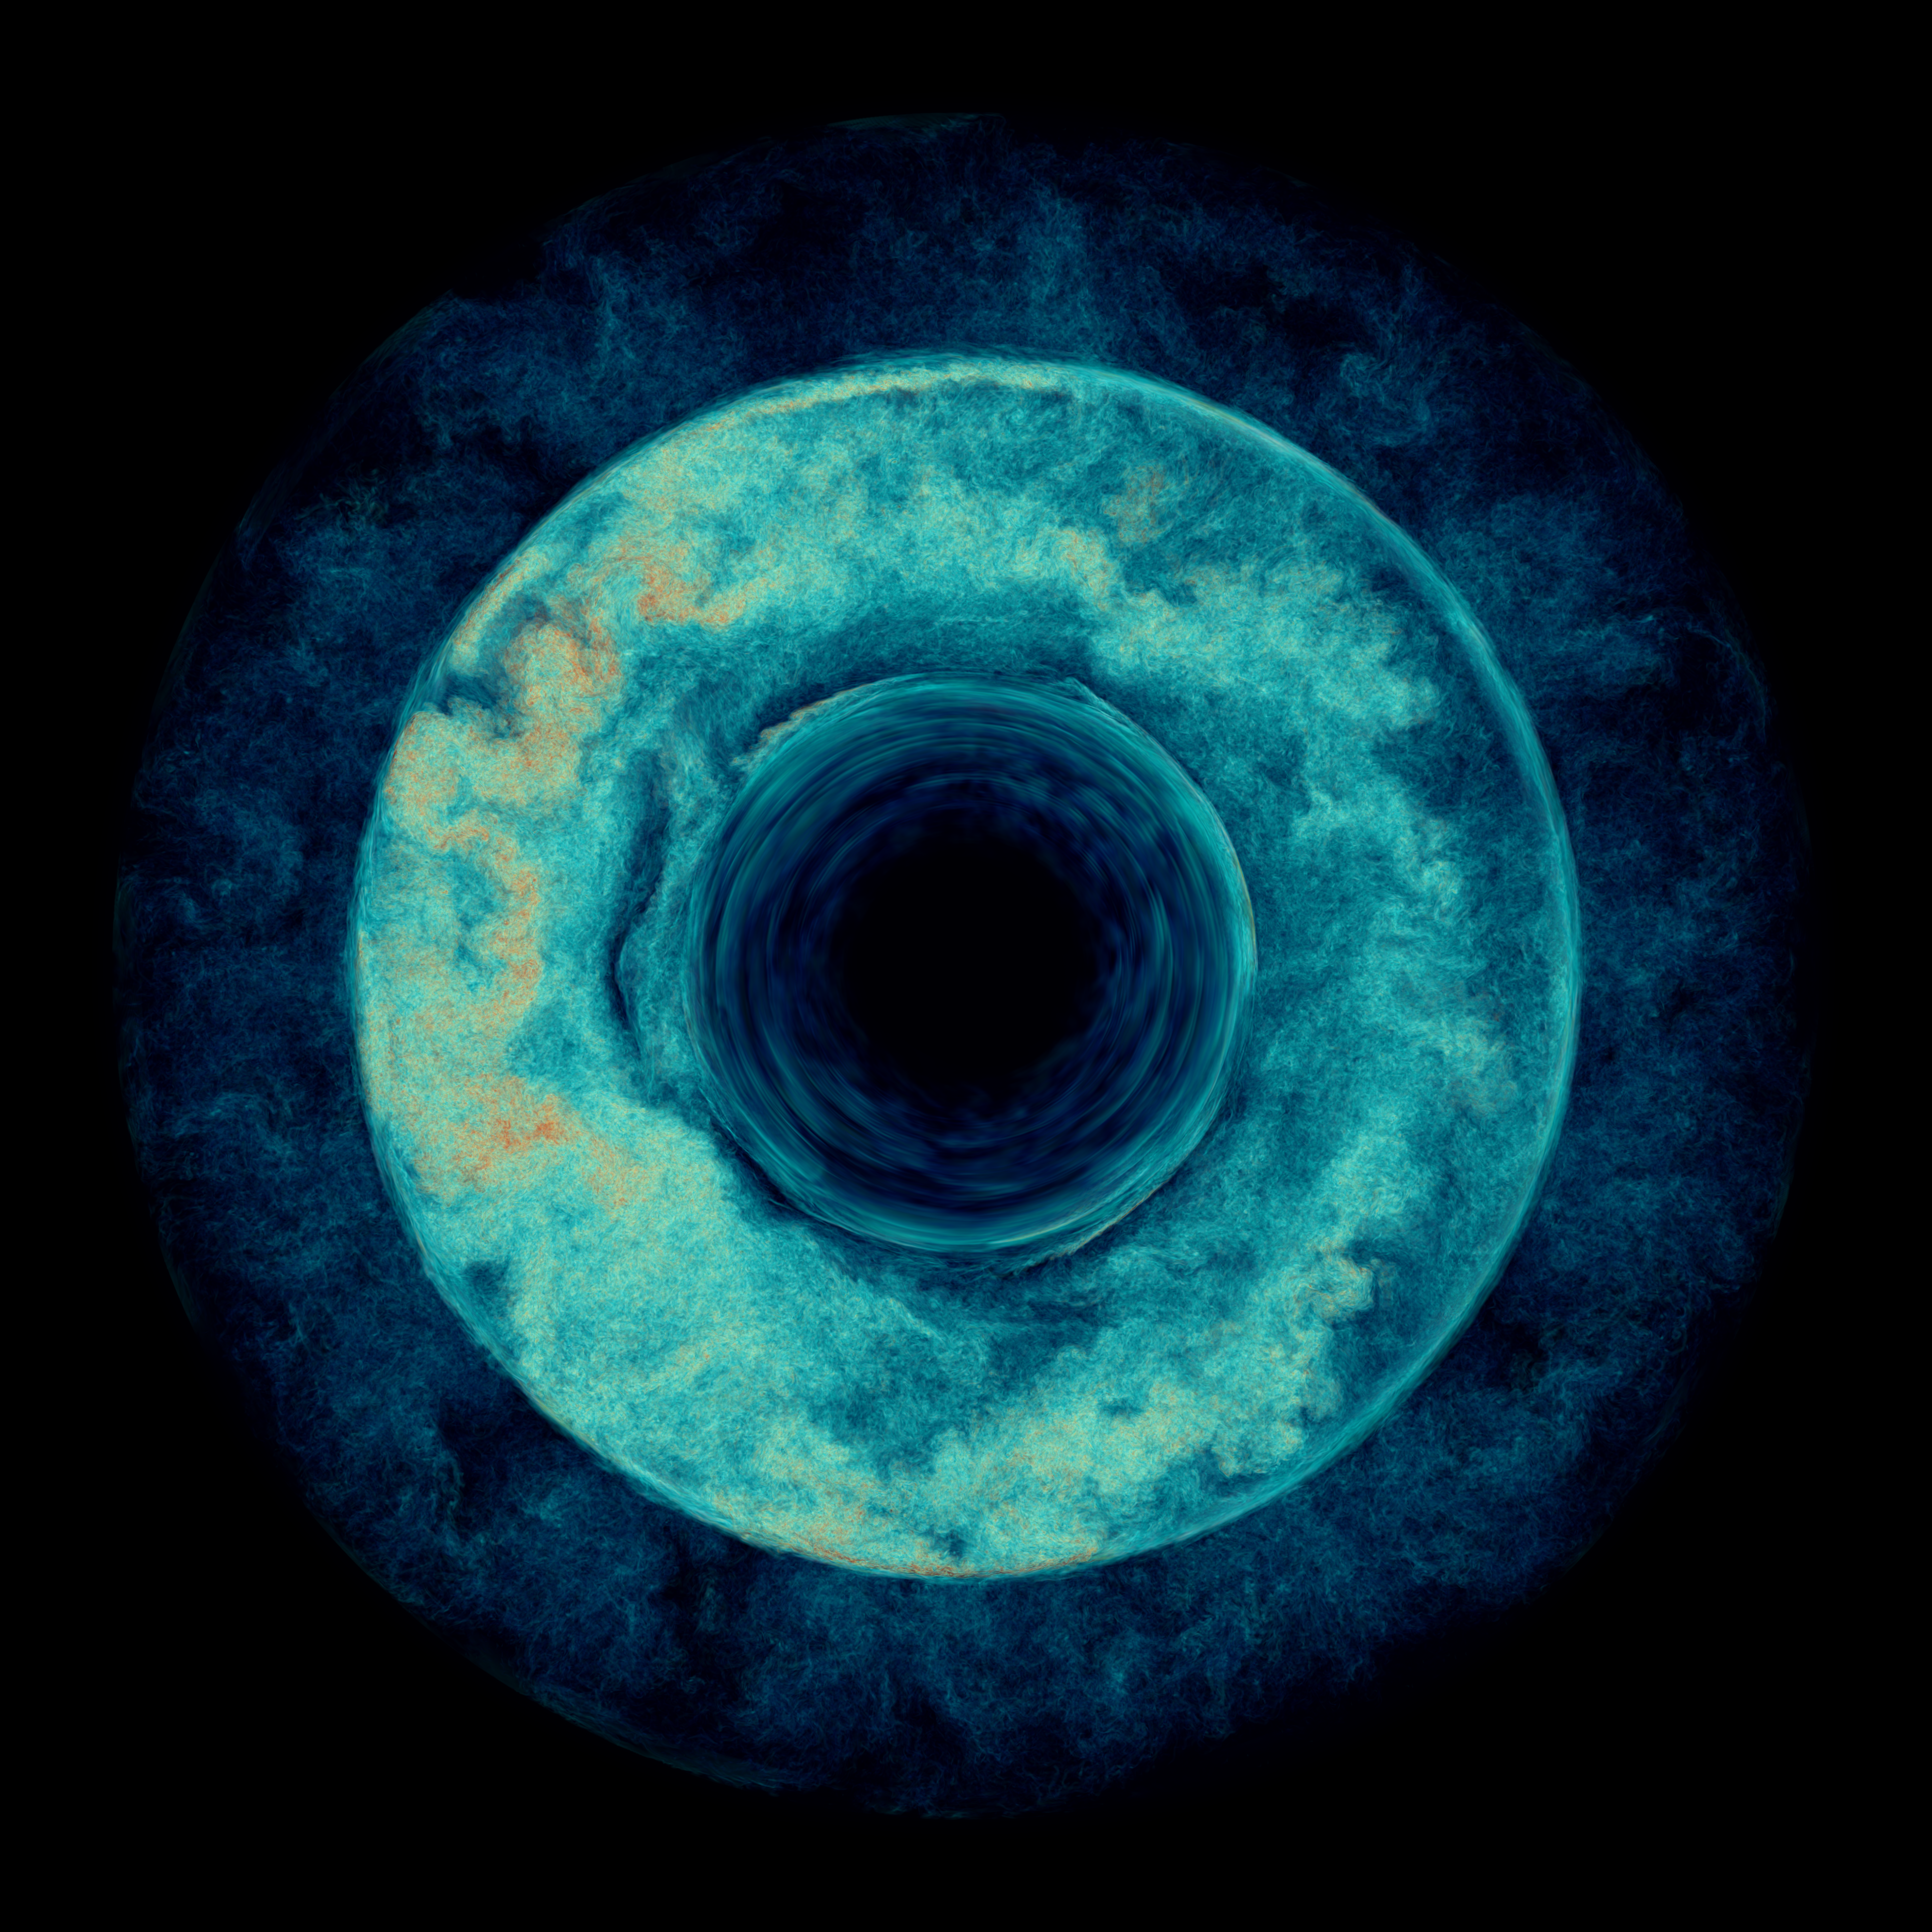
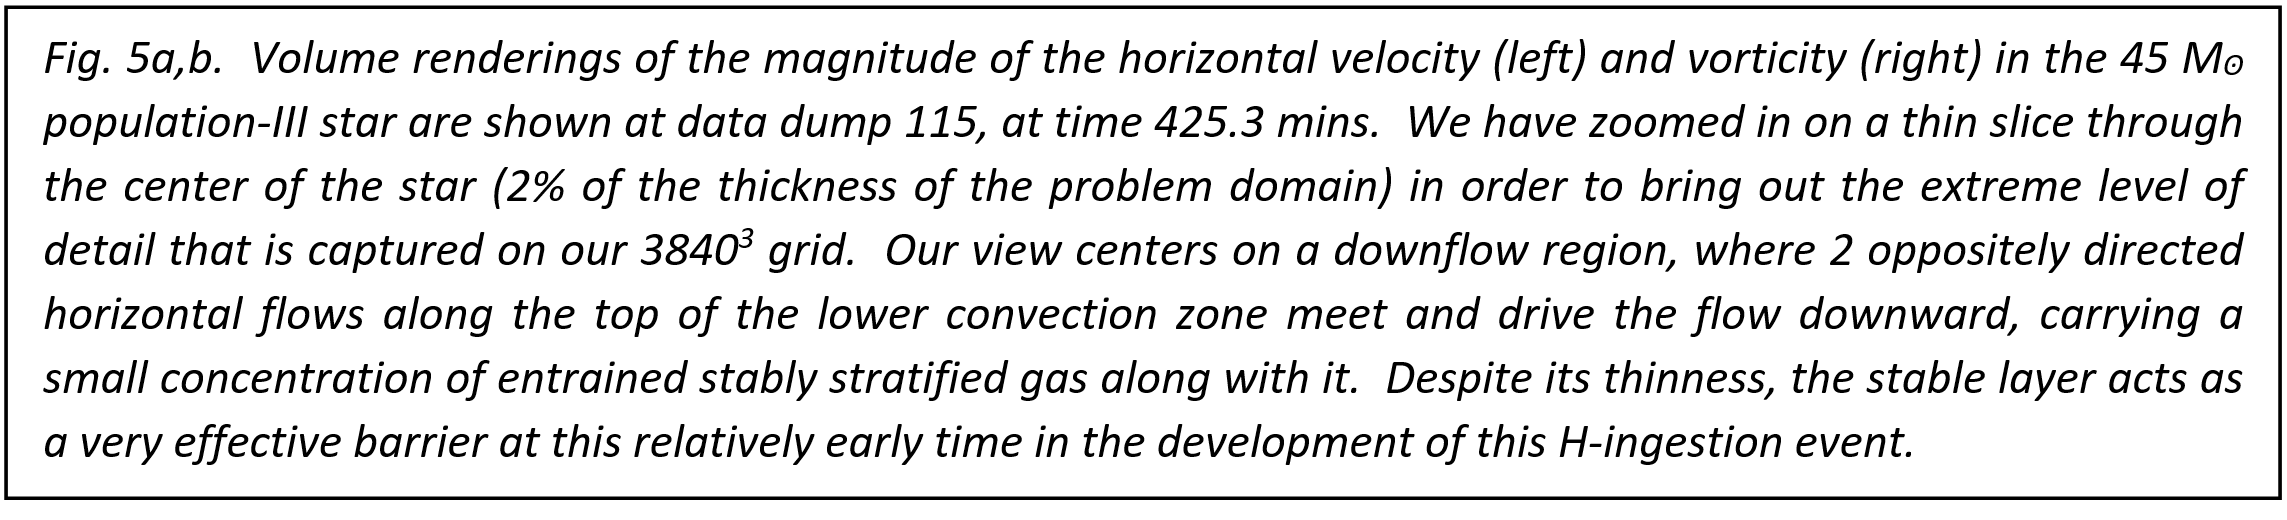
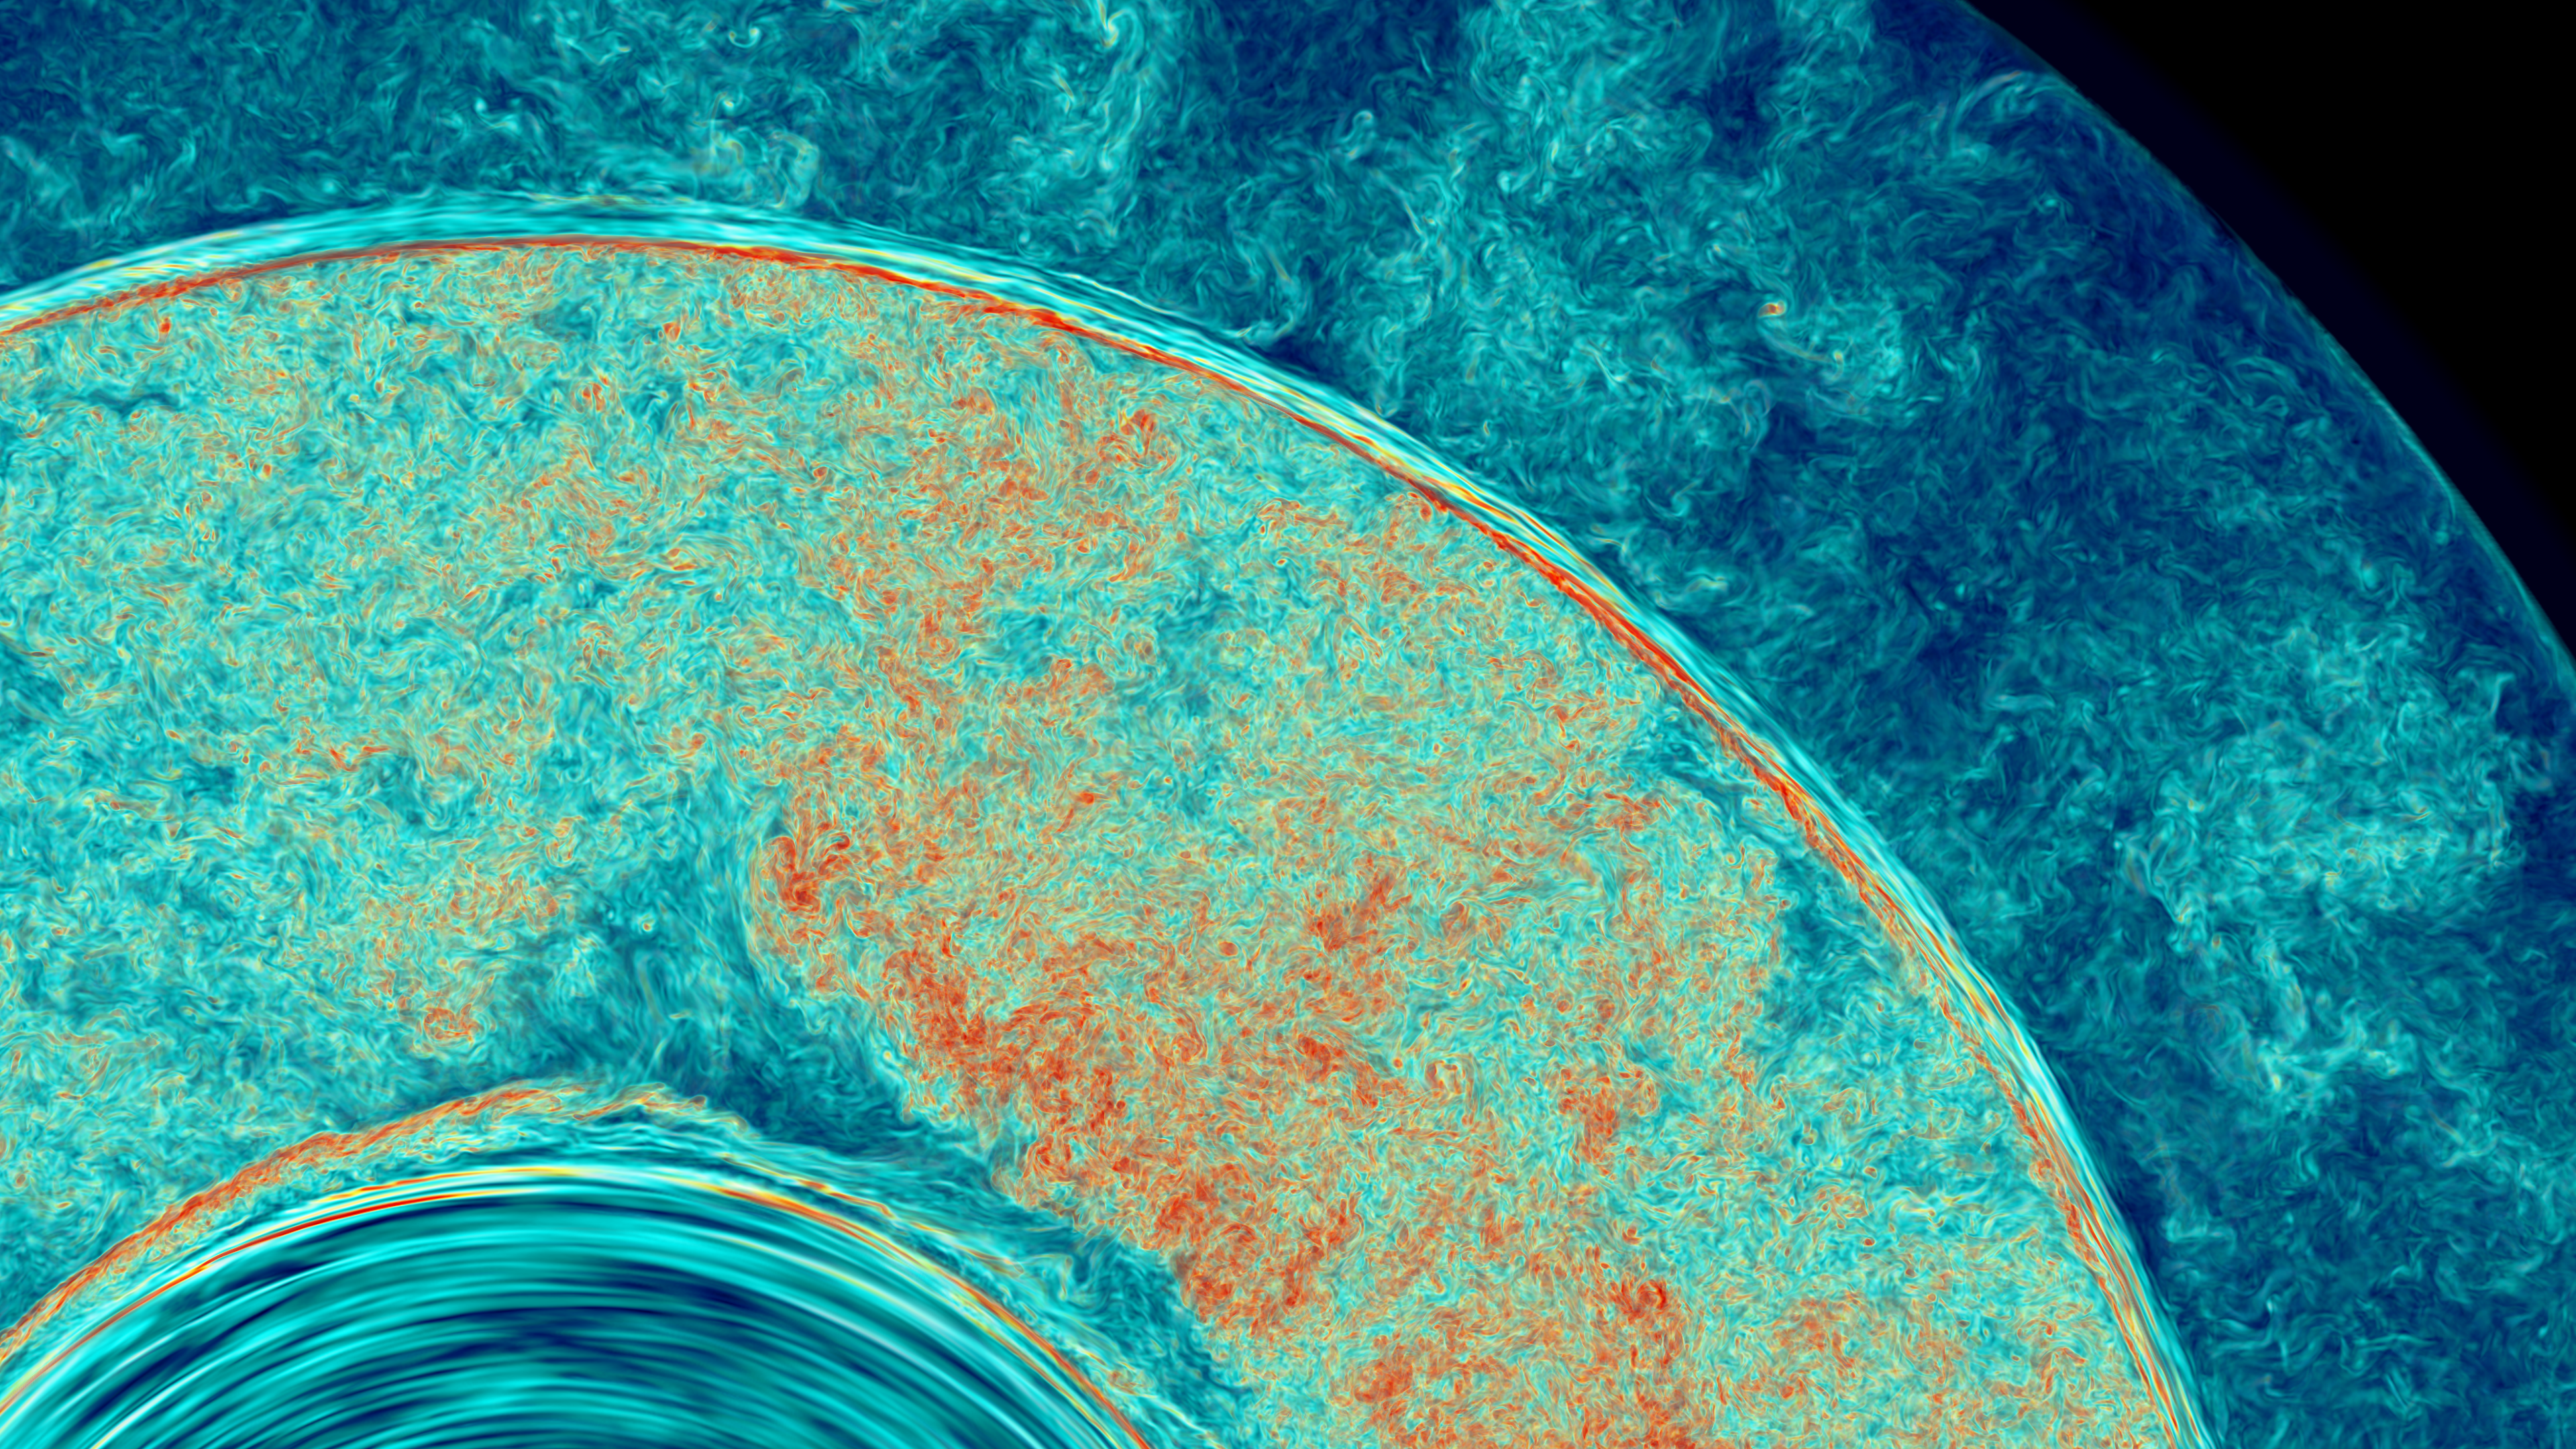
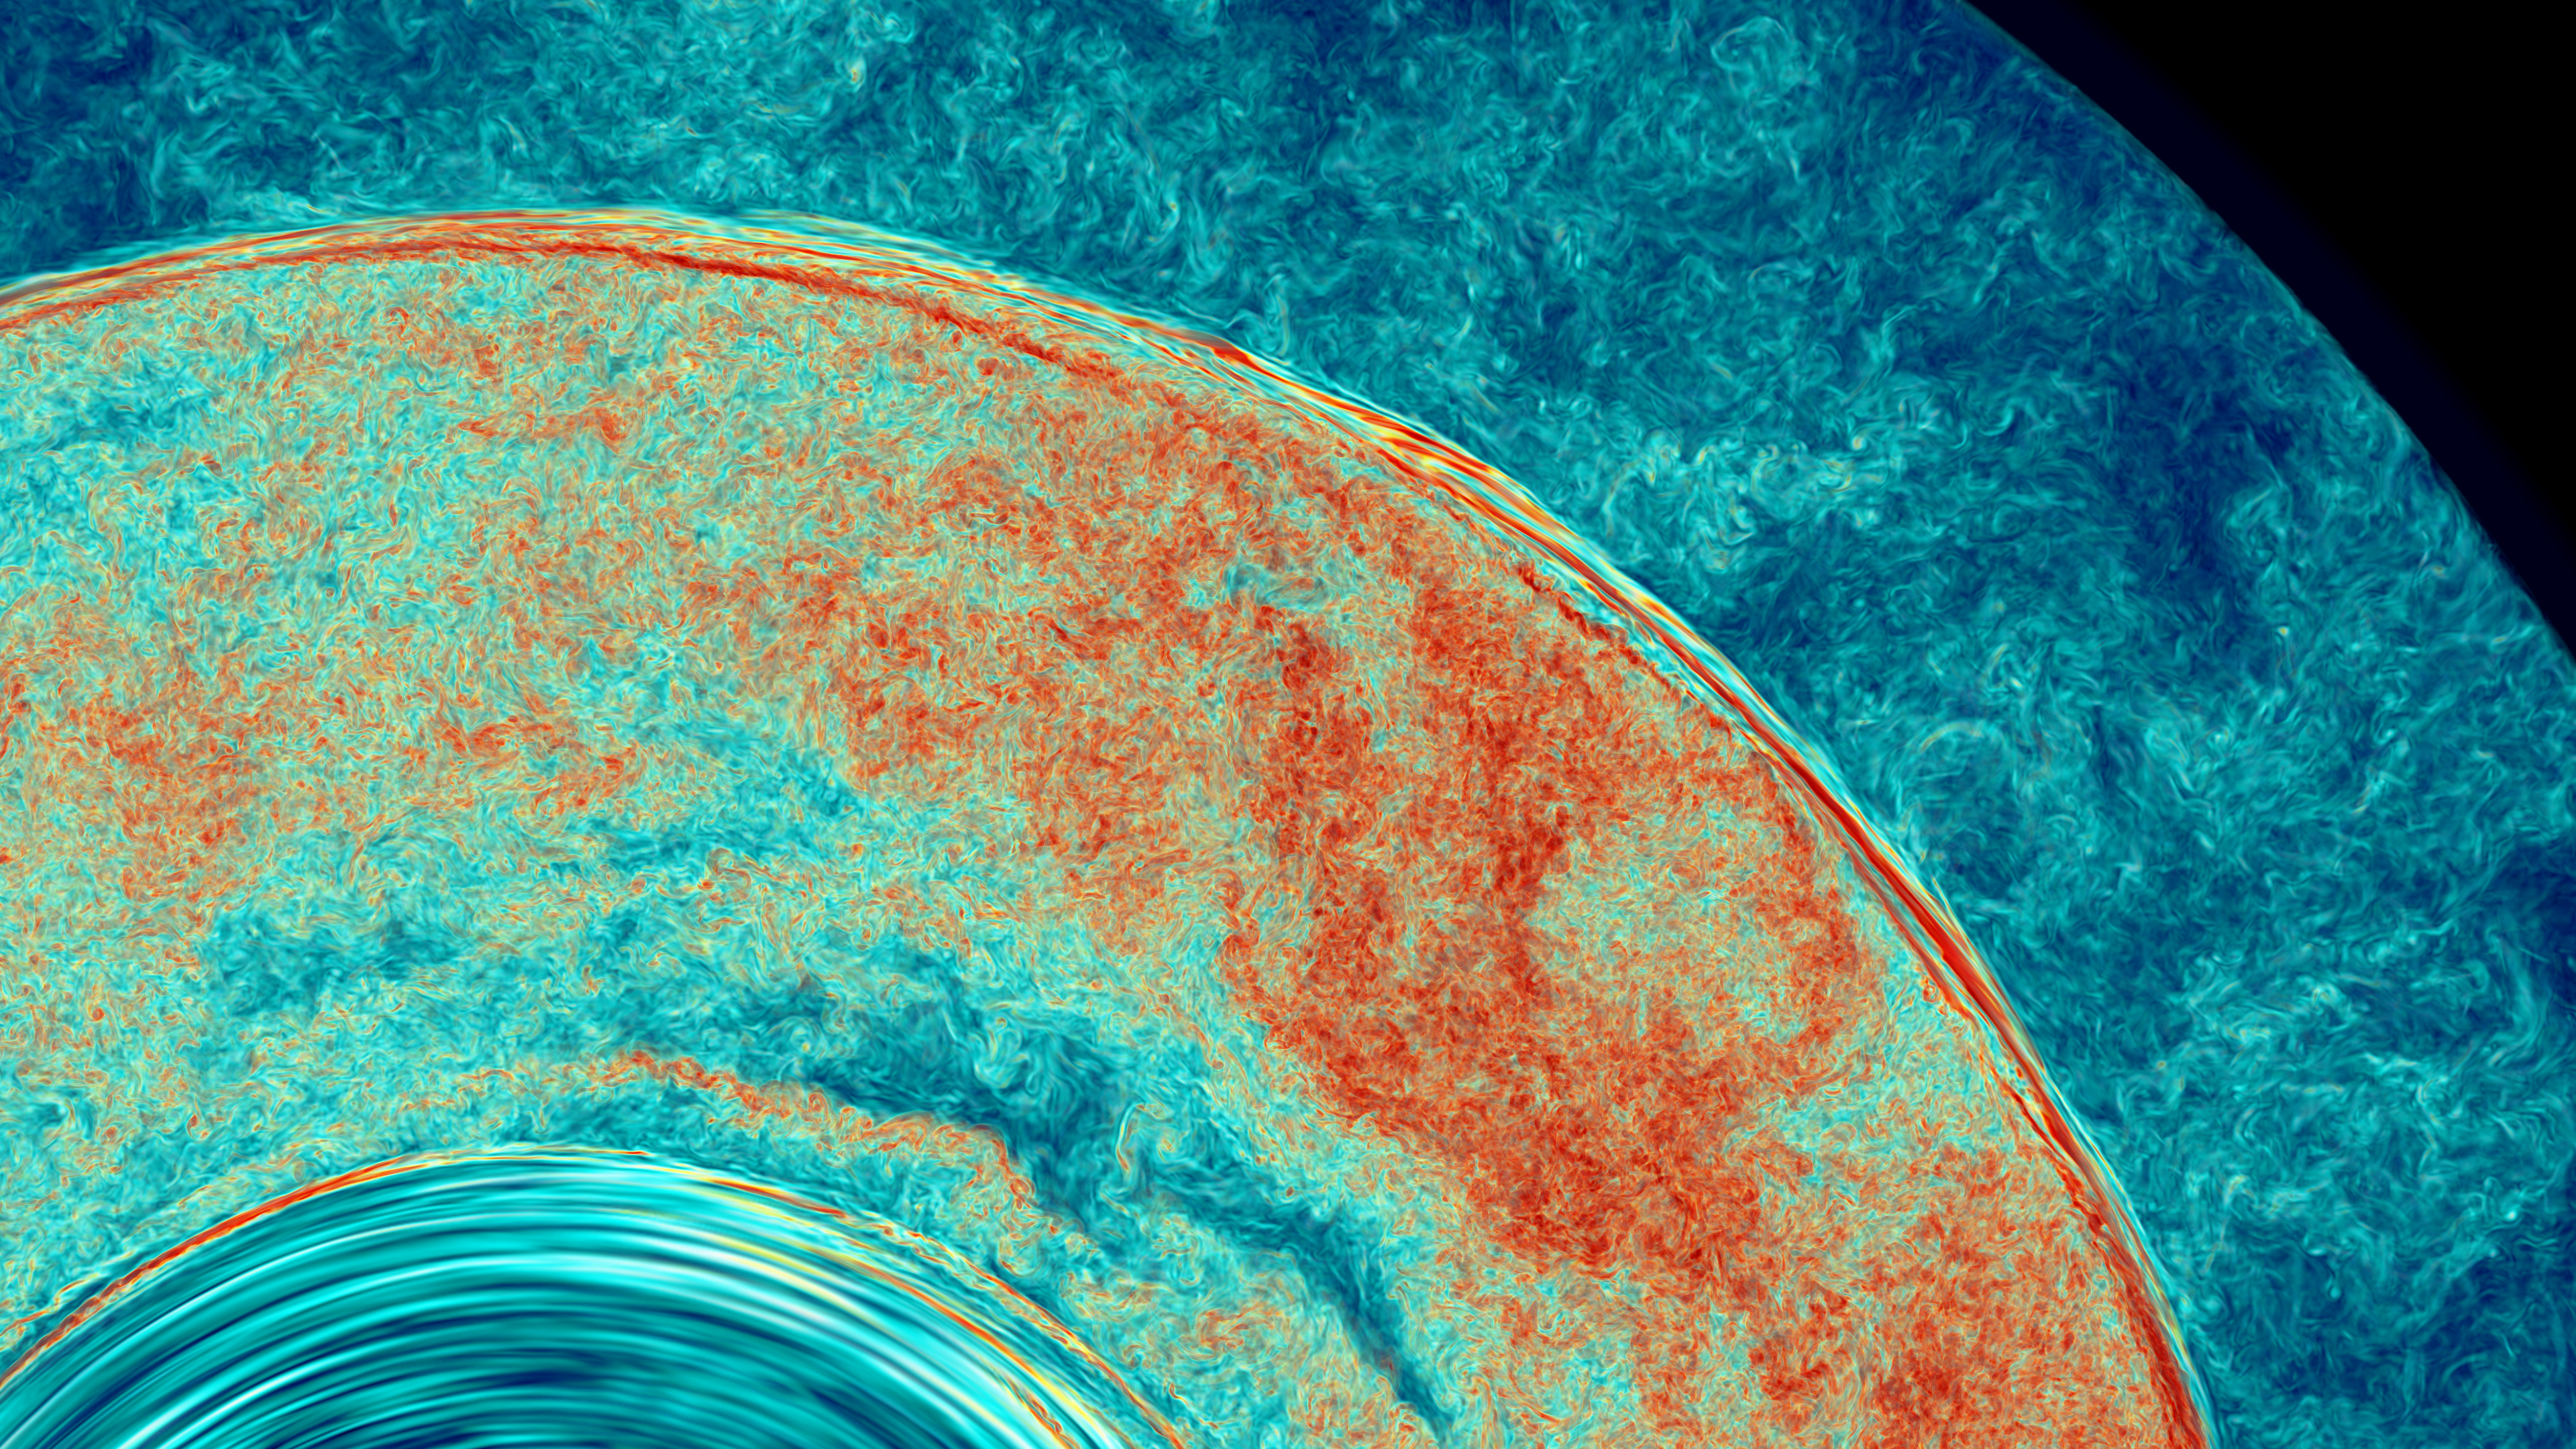
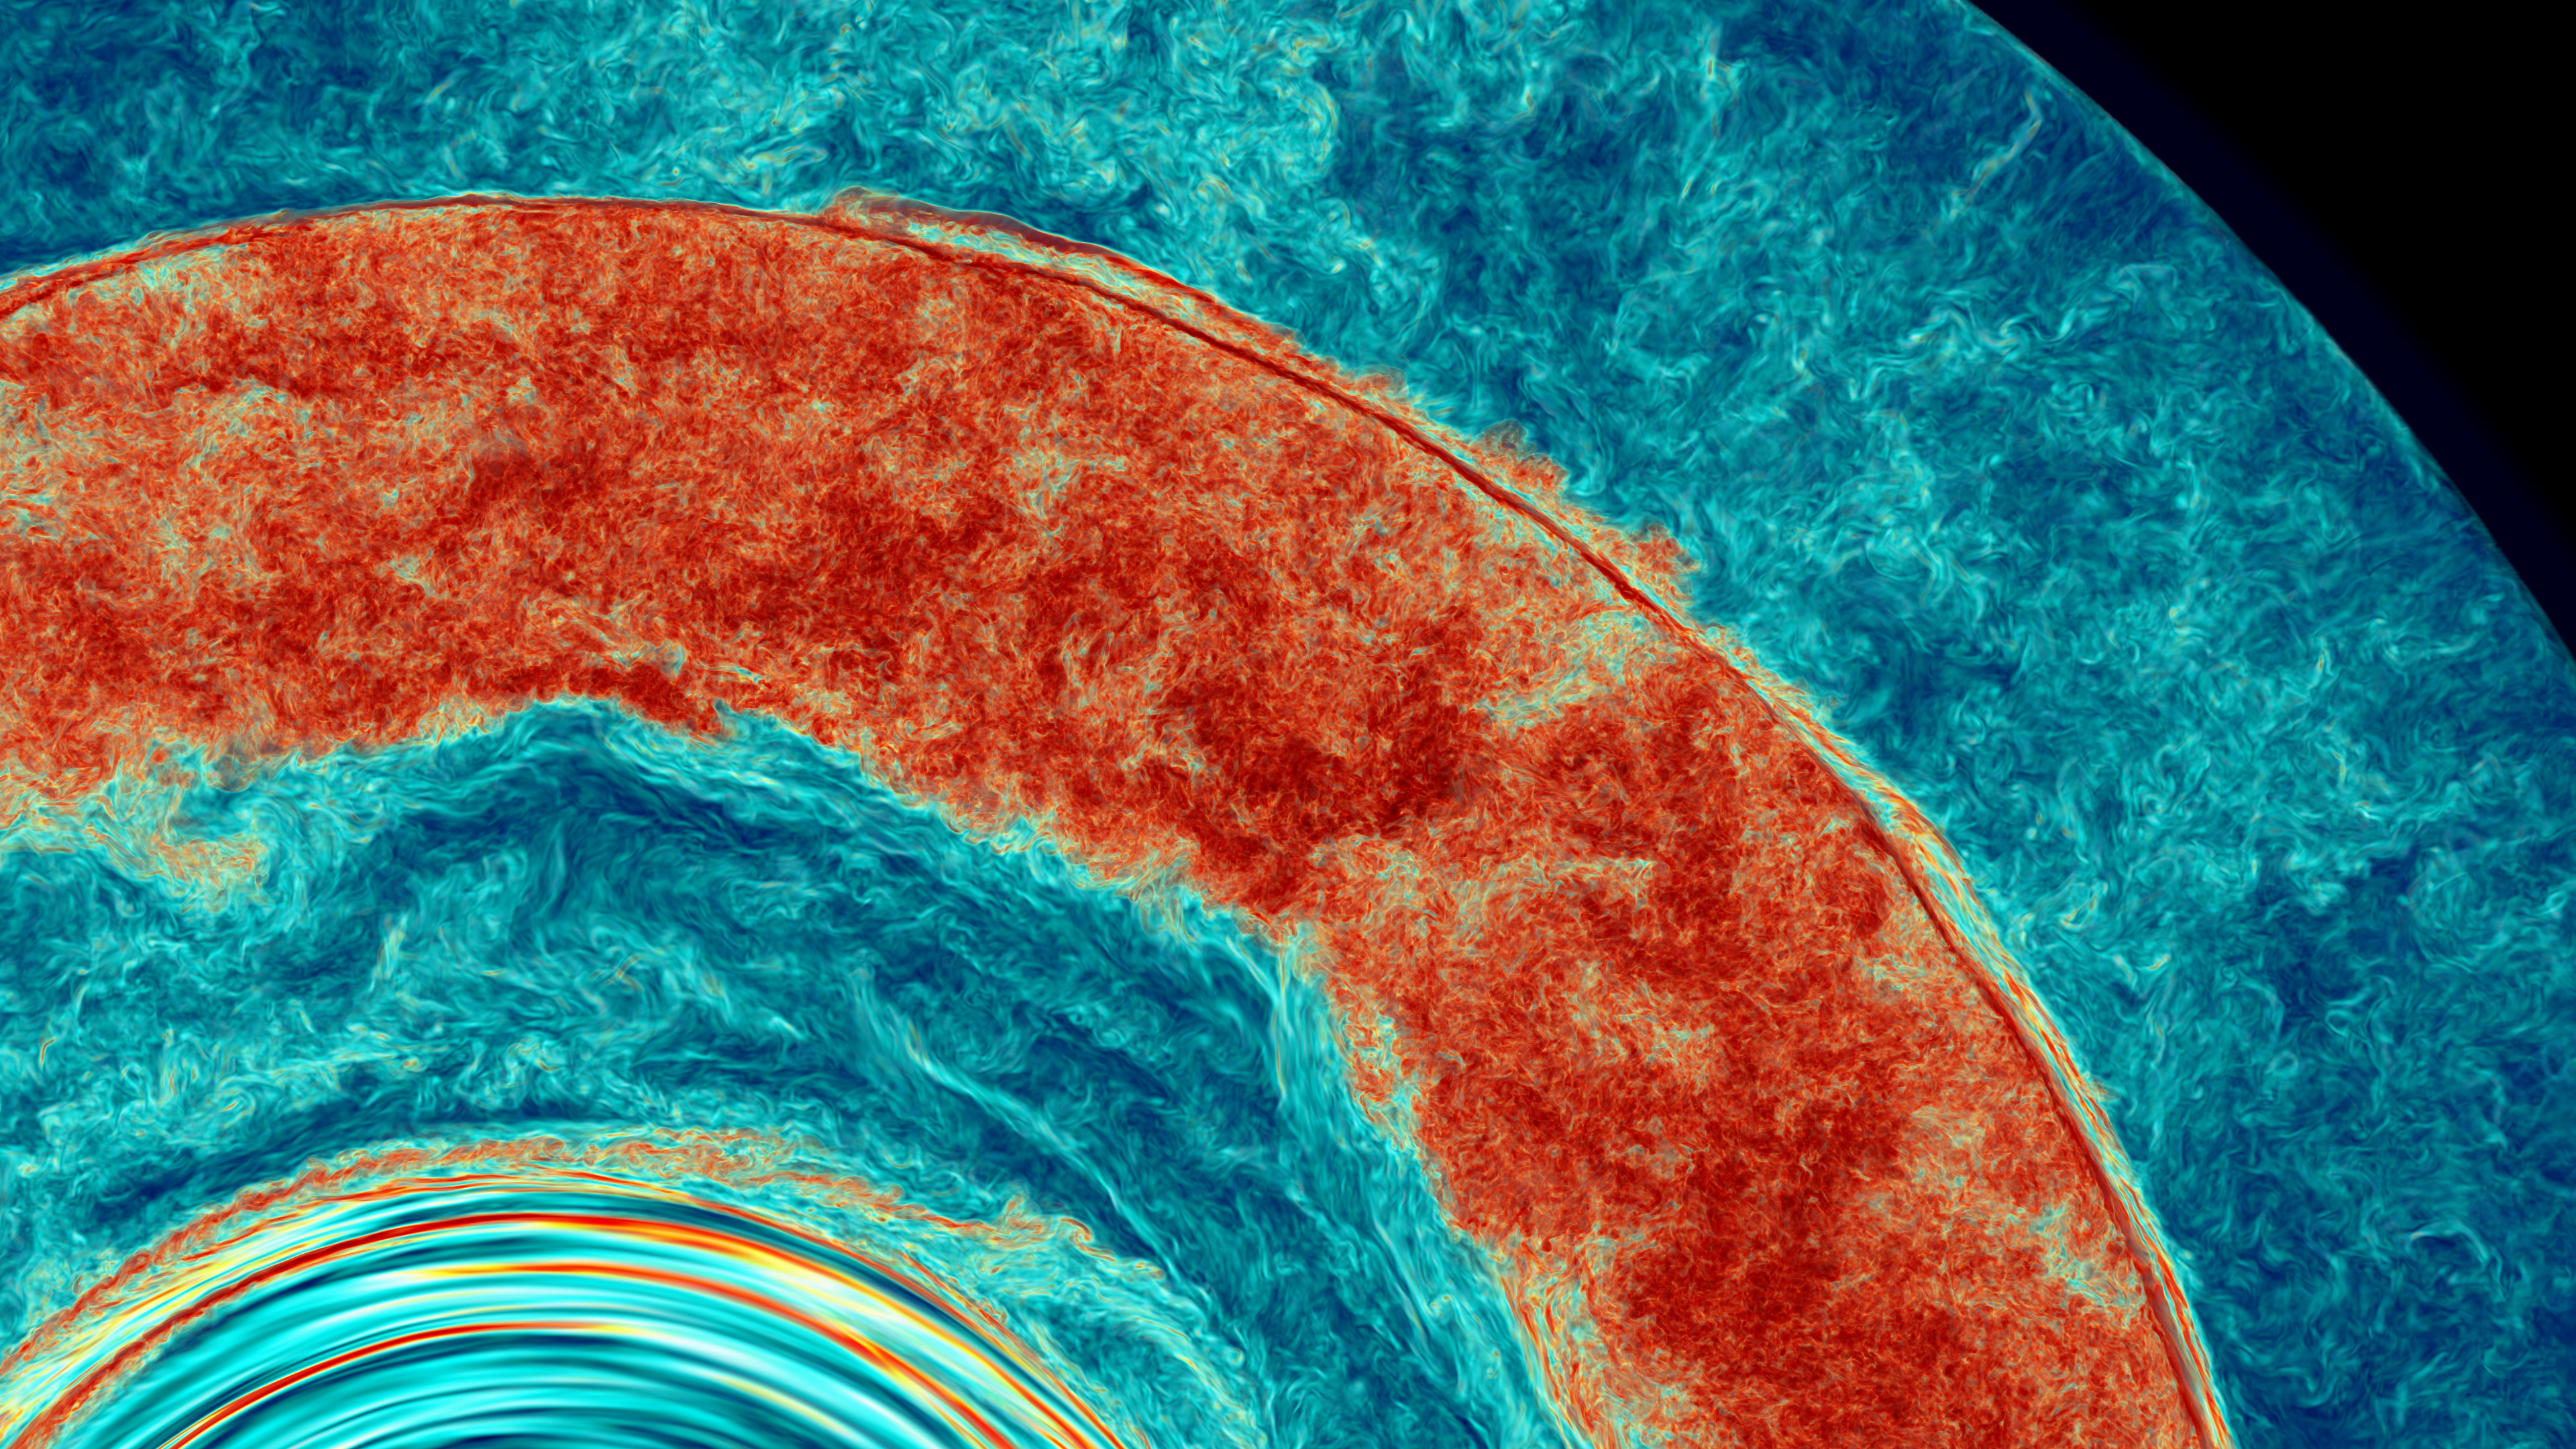
Our PPMstar code simulates stellar hydrodynamics in 3D, using nonlinear governing equations from which an unperturbed, spherically symmetric, hydrostatic state of the star is subtracted out. The code uses the Piecewise-Parabolic Method (PPM) hydrodynamics scheme [1-3], adapted to this context [4-6], and explicitly tracks the evolving concentration of a fluid constituent using the highly accurate Piecewise-Parabolic Boltzmann (PPB) advection technique [3,7]. This tracked fluid constituent is the gas located initially above the convection zone that is driven by the helium burning shell in the AGB phase of evolution of a 45 Msun population-III star. The entrainment of this tracked hydrogen-rich gas into the helium-shell convection zone is the cause of the hydrogen ingestion flash under study. By tracking this gas concentration using the PPB moment-conserving technique, we devote special subgrid-cell resolution to this critical variable. By subtracting the unperturbed state of the star out of the dynamical equations, we are able to perform the entire calculation in 32-bit precision at double the otherwise achievable execution speed. In the robust version of PPMstar that we used in this work, we use a gamma-law equation of state for the gas, with gamma equal to 5/3, and we approximate the effects of radiation pressure by adjusting the unperturbed state of the star and by adjusting the computation of the relevant nuclear reaction rates. We are developing an enhanced version of PPMstar that will not need to make these approximations, and that will also carefully track a variety of different constituents of the gas. That code will be used in future work. The special computing opportunity provided to us at the end of October, 2019, allows us to see for the first time a very high resolution, and highly detailed simulation of 2 interacting stellar burning and convection shells, separated by a thin stably stratified gaseous layer (see Figs. 1 & 2). Toward the end of our period with access to all of Frontera, we were also able to supplement this study with a run with the nuclear burning of ingested fuel turned off, so that we can clearly separate out the nonlinear feedback effects from this combustion on the star's behavior.
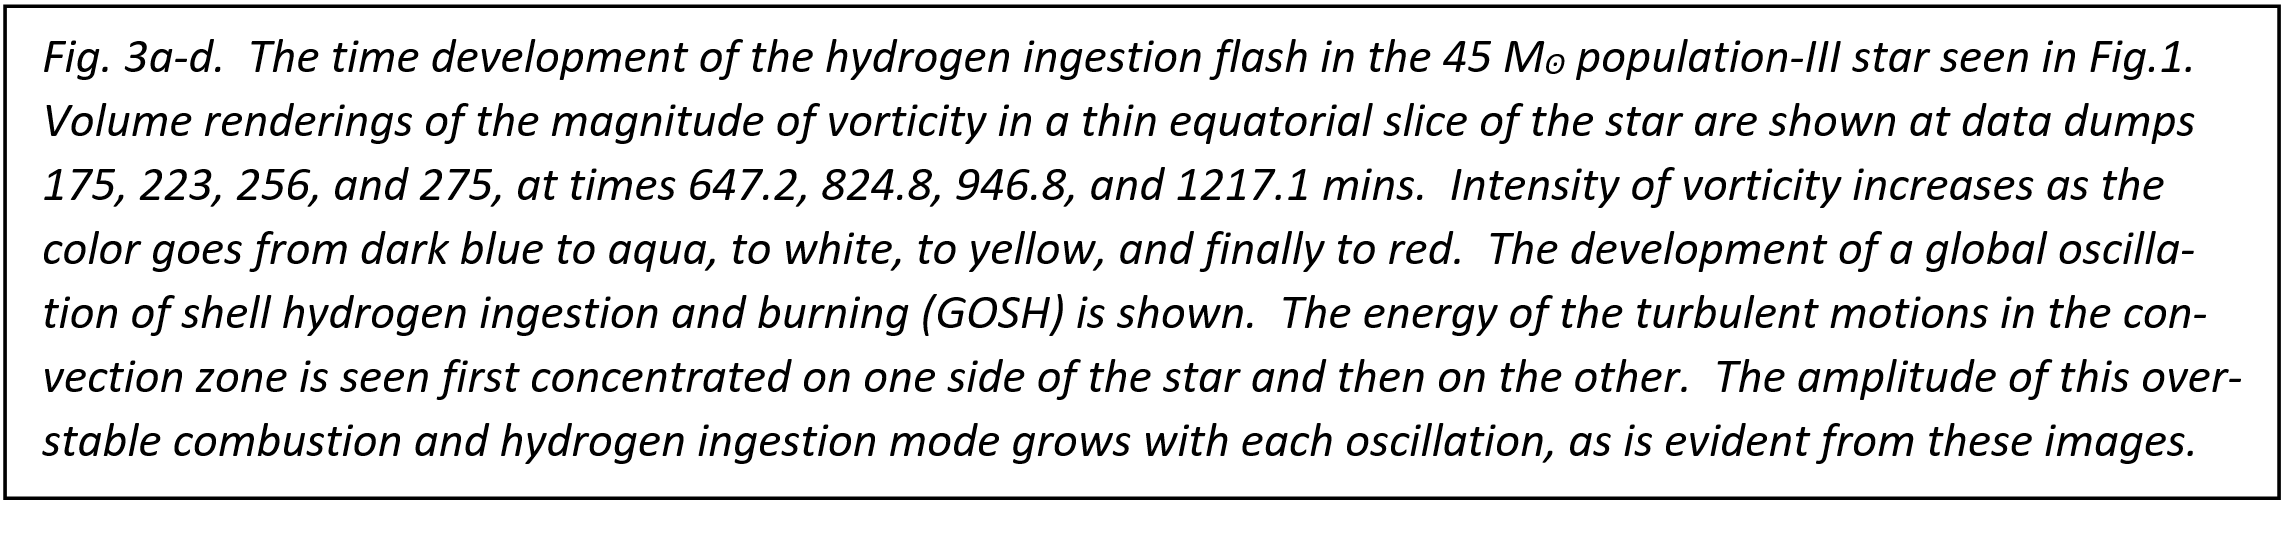
Matching the simulation to the machine. Our PPMstar code [5,6] subdivided the cubical computational domain of this simulation into 63 cubical regions, each managed by a team of 2 administrative MPI ranks and updated continuously by 128 MPI worker ranks. Each worker updated 4 cubical grid bricks composed of 203 cubical grid briquettes of 43 cubical grid cells each (cf. [5]). This decomposition of the problem gave us 442,368 bricks of 803 grid cells updated by 28,080 MPI ranks, which we distributed over 7020 nodes of the Frontera machine. This left us with about 1000 nodes, which we used to run lower resolution jobs that could course ahead of the large simulation in time to give what amounted to weather forecasts for that run, allowing us to guide the simulation, as described below. Our PPMstar code reports its computational performance as it runs. These reports are based upon manual flop counts, using the standard definition of the flop, but at the time of this run these counts were somewhat out of date. We believe that they are undercounts, because added features of this relatively new code are not all properly credited in these counts. In particular, no credit is given for the rather large amount of work performed to compute the nuclear burning. Despite these counts being out of date, they are of course consistent, so that we can use the code's performance reports to optimize a problem decomposition and layout on any given machine. It is important to understand that the reported computation rate includes only work in the main computational module, which certainly is dominant, and uses as its time measure the wall-clock time reported by the machine. Thus all costs of disk I/O, MPI messaging, volume visualization of 10 variables every 5.7 minutes, construction of global radial profiles of 64 quantities, etc., are included. Our administrative overhead for the run consisted of our two relatively underemployed administrators in each team of 130 MPI ranks, which amounts to an overhead cost of less than 2%. MPI messaging comes at essentially no cost if the configuration on the machine is properly optimized, as it was in this run. The worker ranks make volume visualizations of their bricks and compute contributions to the global radial profiles at each dump interval of roughly 5.7 wall clock minutes. Whatever time this takes them is added of course in the wall clock time, but no credit is given in the flop counts for this work, which is relatively inconsequential. Overall, the 7020 nodes computed onward relentlessly at 15.9 time step updates per second for days, which corresponds to a code-reported computation rate of 4.0 Pflop/s. Convective boundary mixing and the hydrogen ingestion flash. For the last several years, our team has been investigating the consequences for stellar evolution of convective boundary mixing (CBM). Stellar evolution codes approximate the effects of convection using the 1-D models of this phenomenon provided by mixing length theory (MLT). This provides a fairly good description of convection, to the extent necessary to evolve the star; however, there are problems near convective boundaries. Work of several investigators [8-15] shows that at these convective boundaries, some of the stably stratified gas on one side of the boundary can become incorporated into the convection flow on the other side. Even if only a small concentration of the stably stratified gas becomes entrained in the convection flow, this entrainment can have very significant effects.
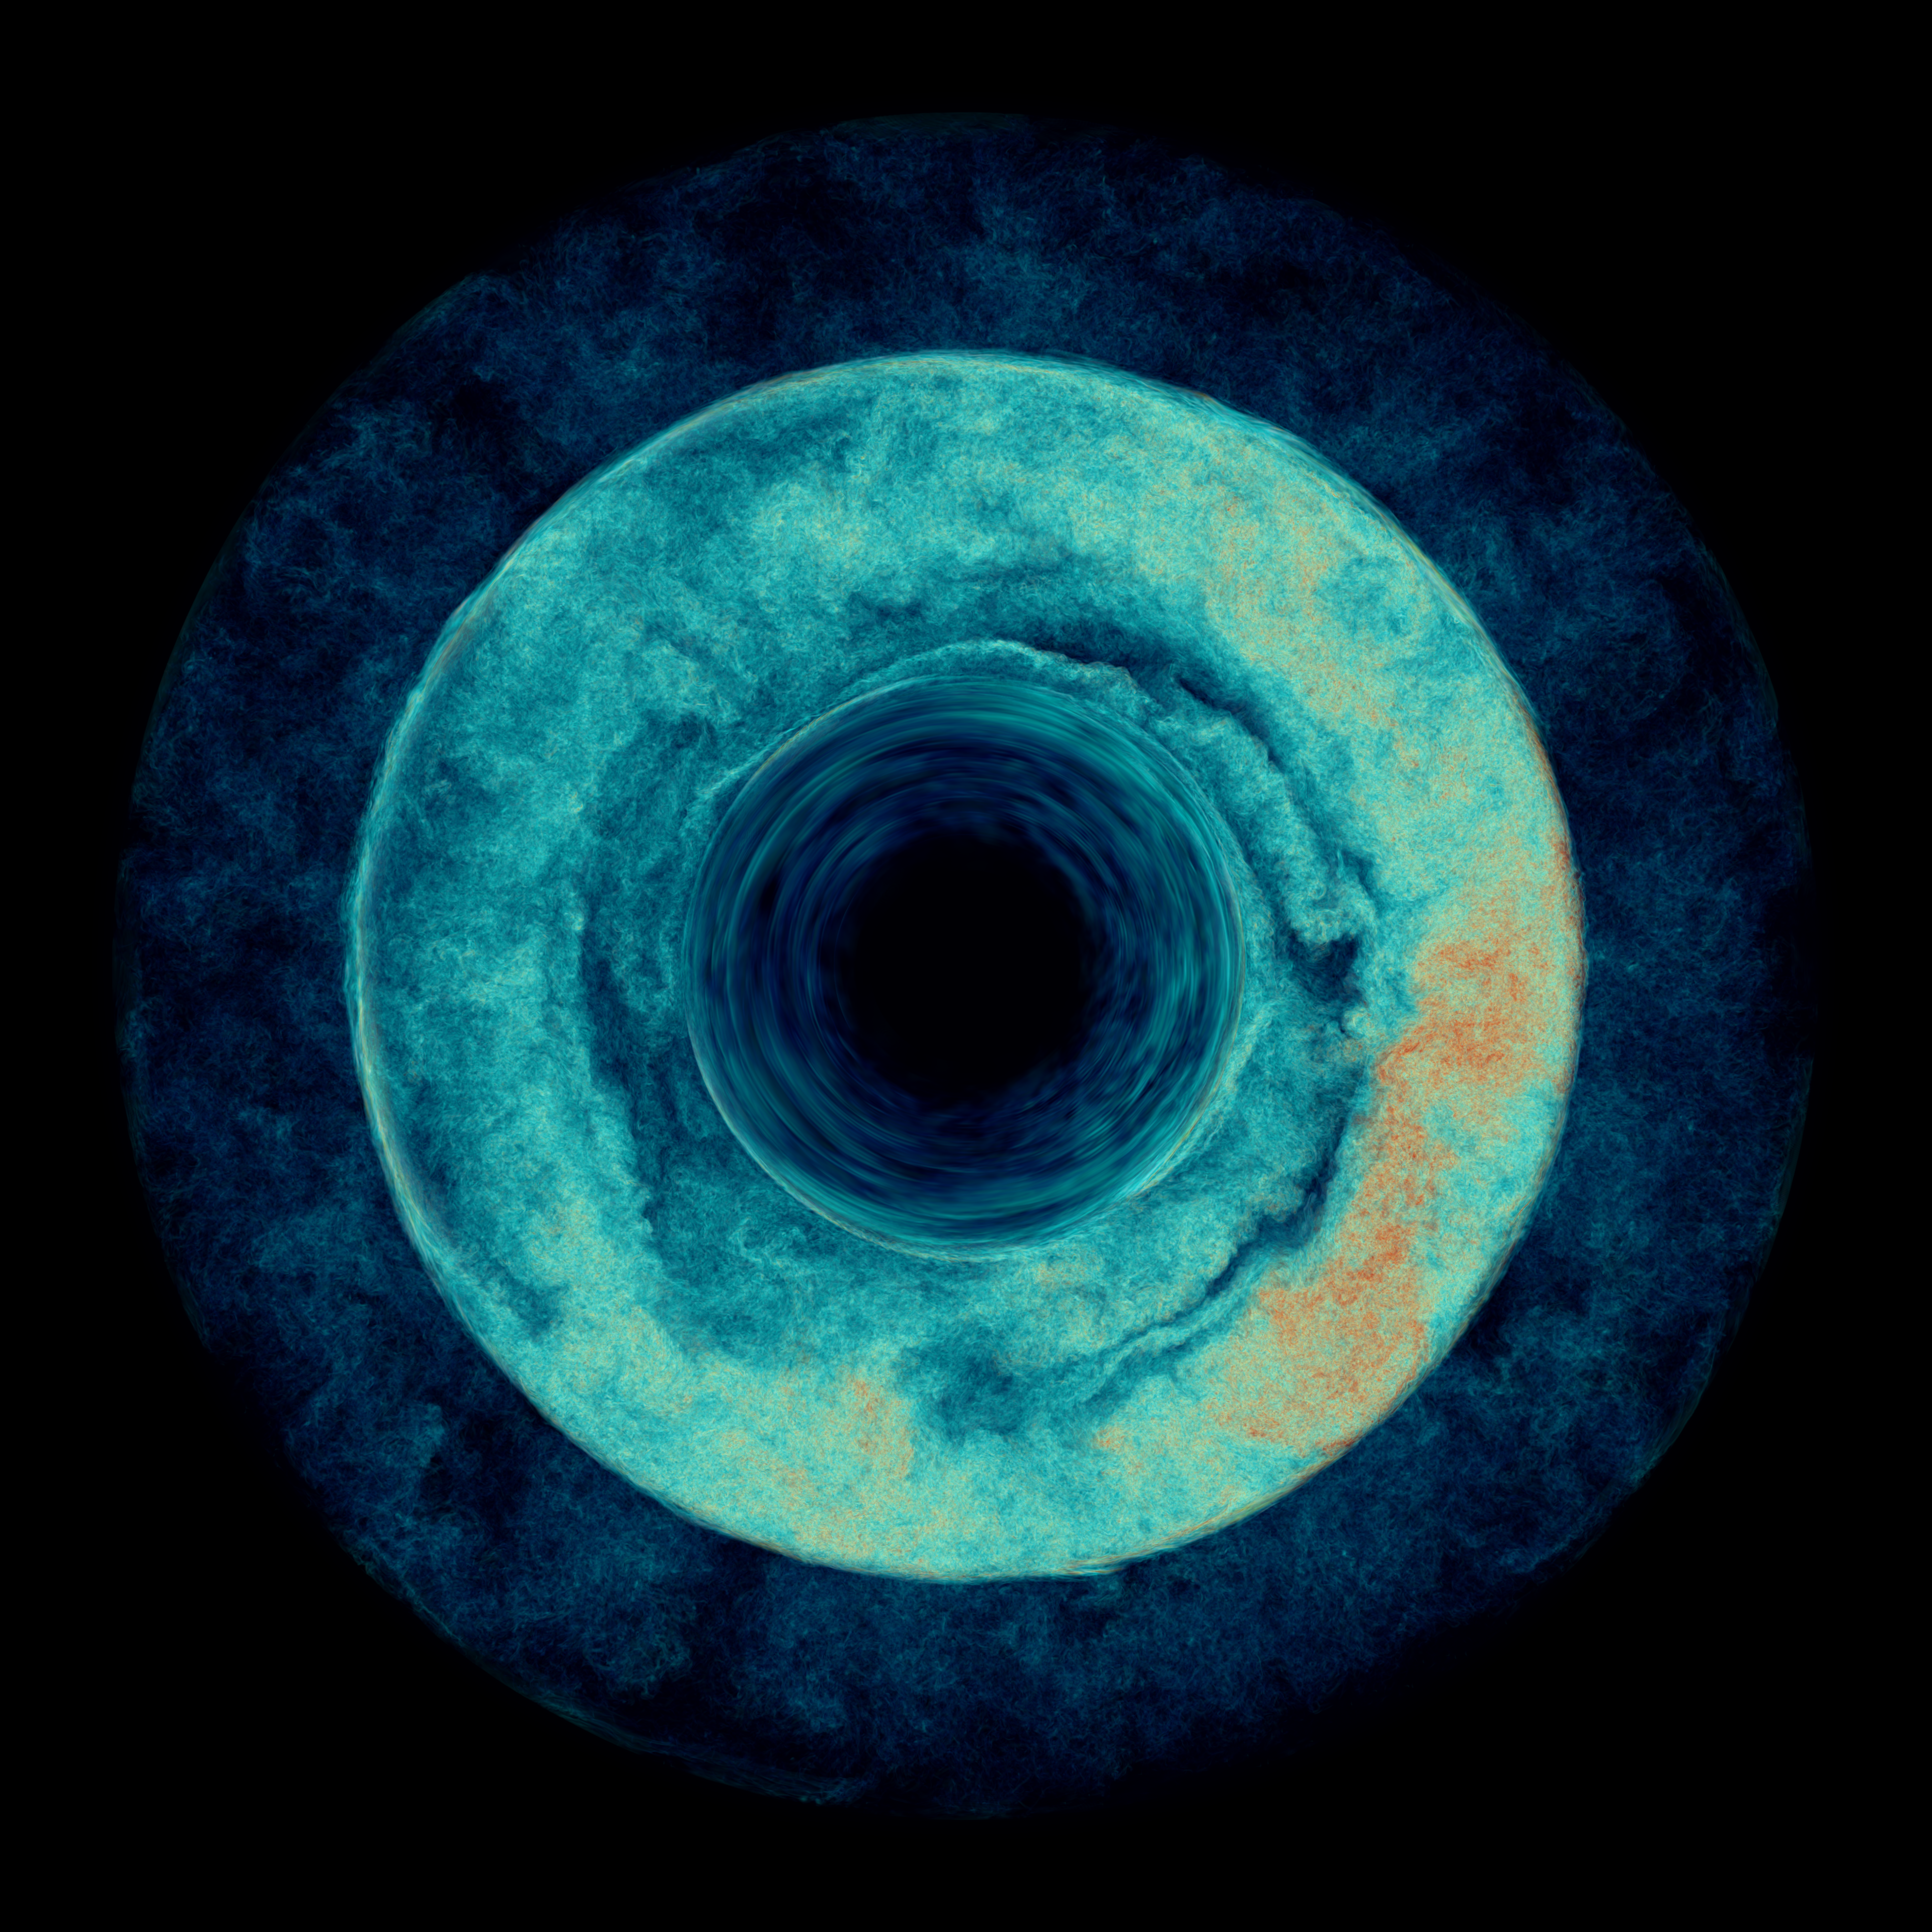
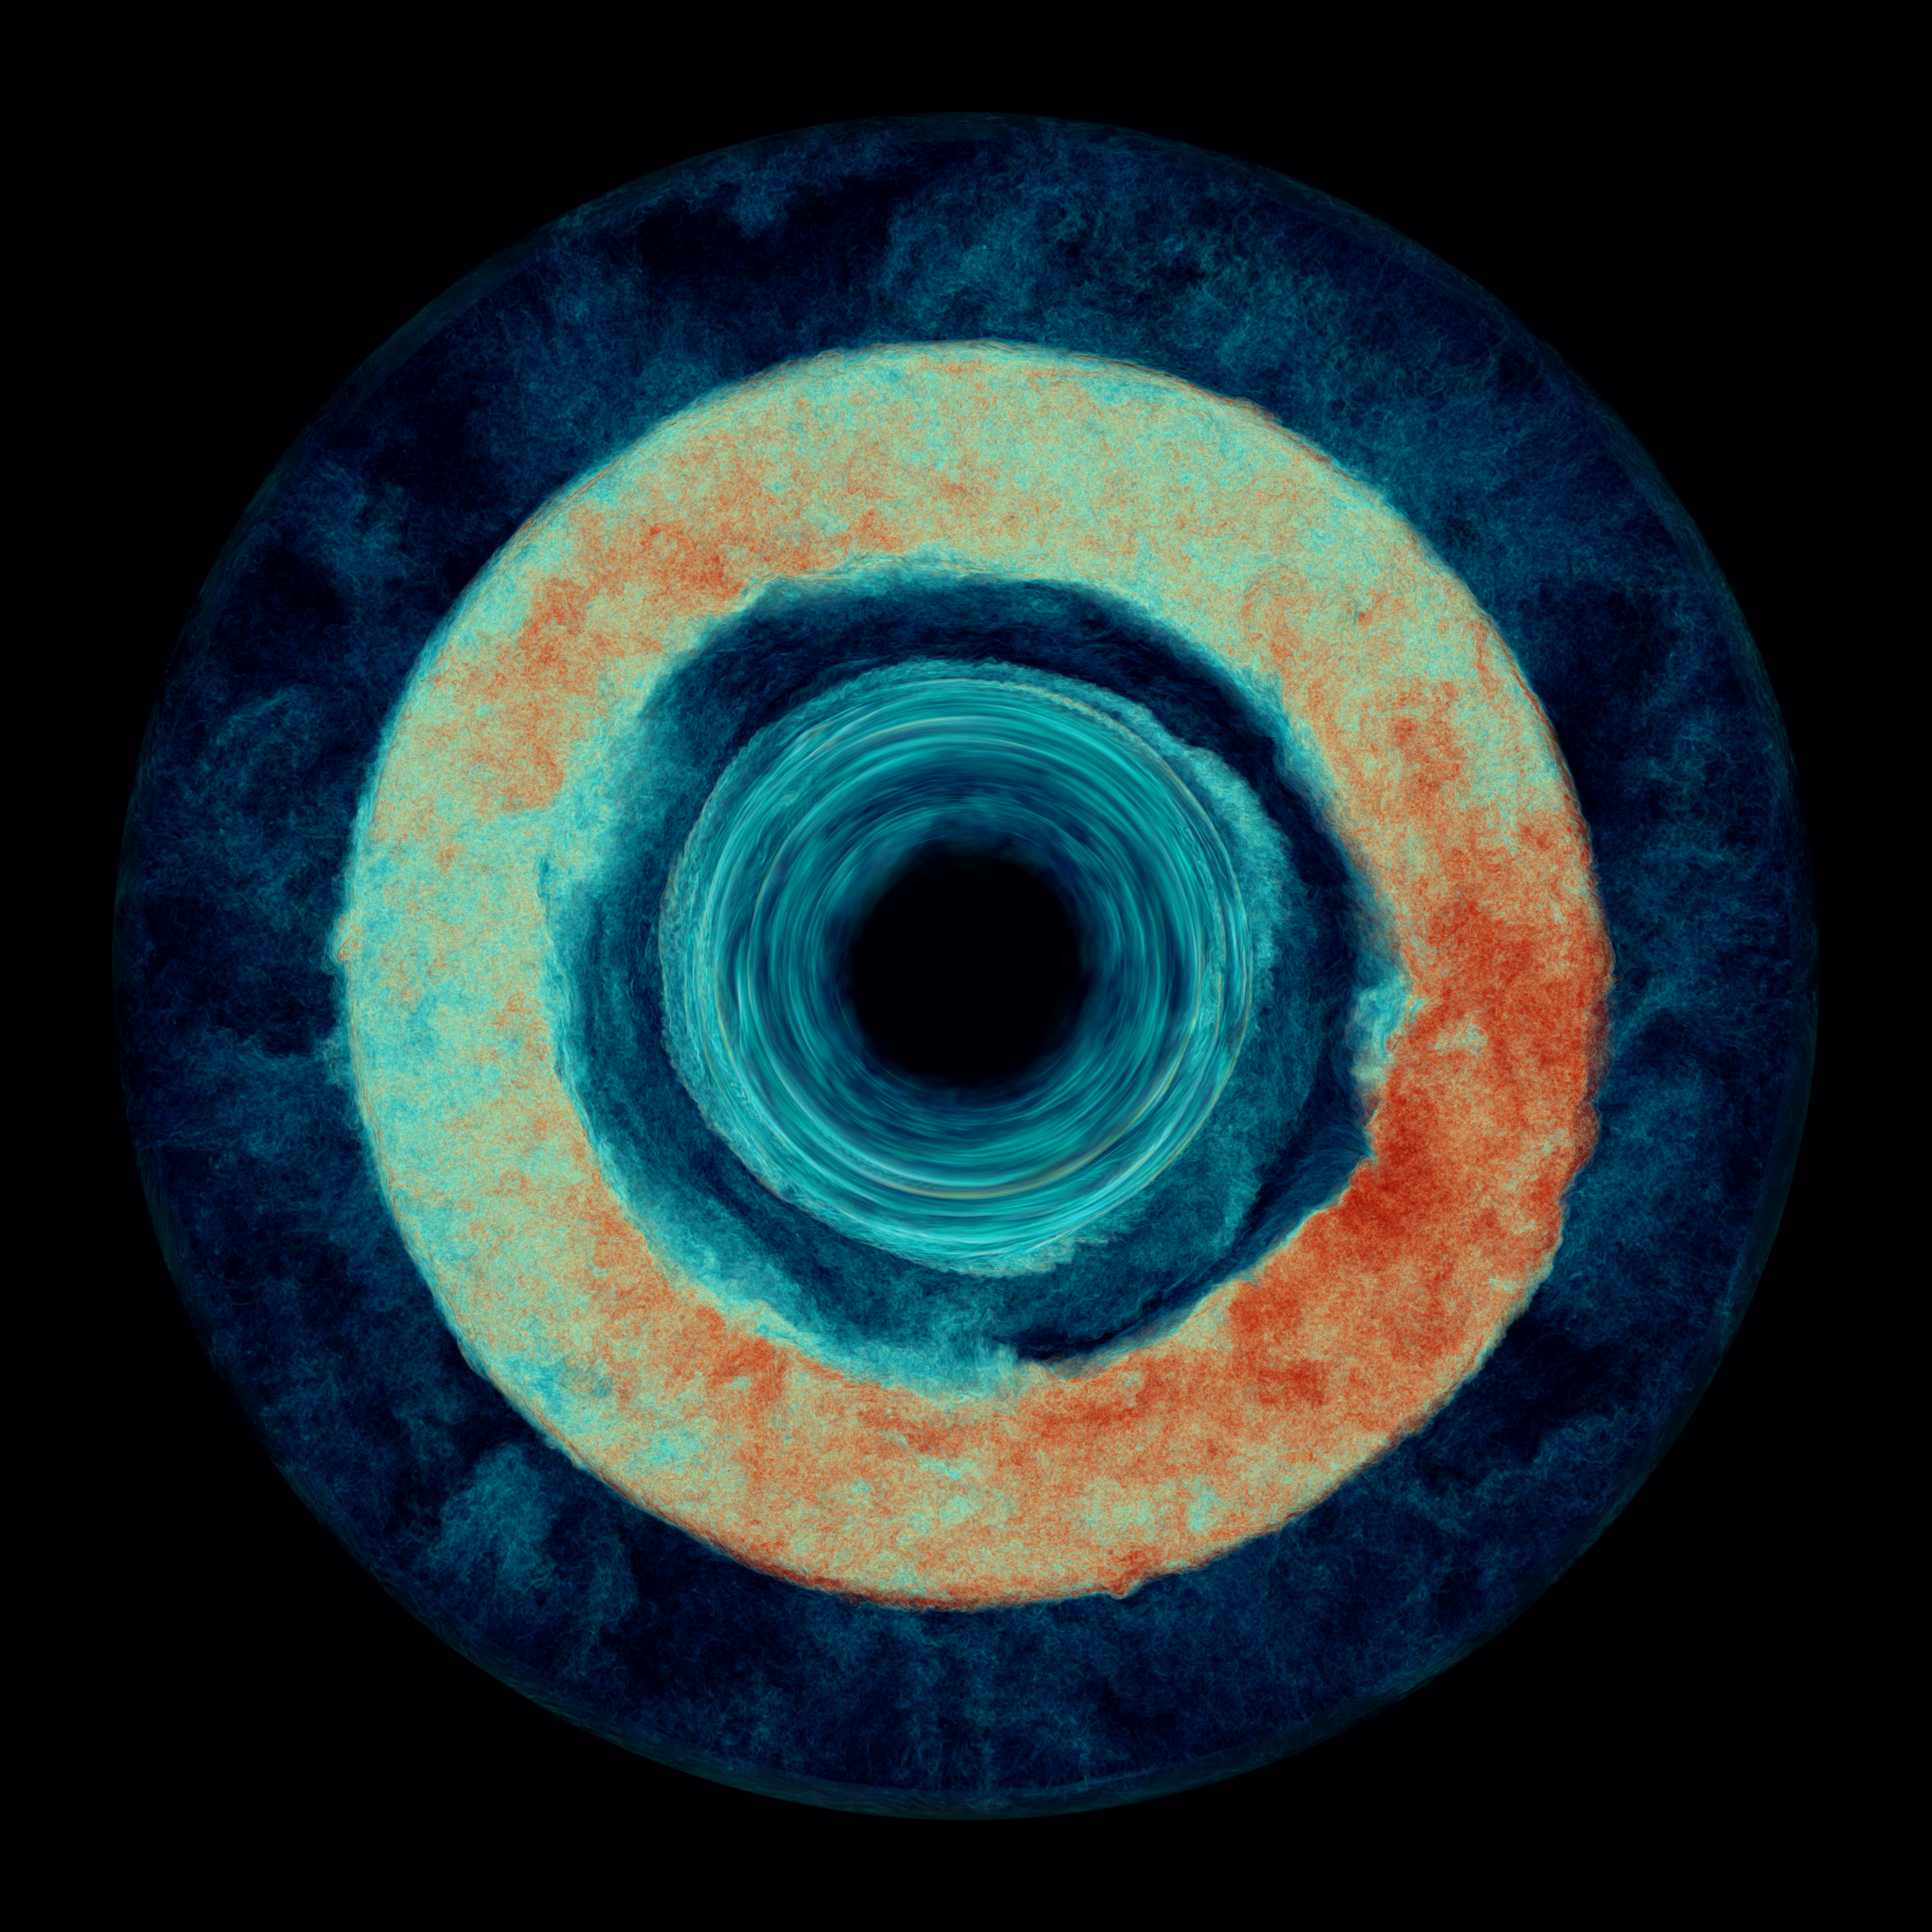
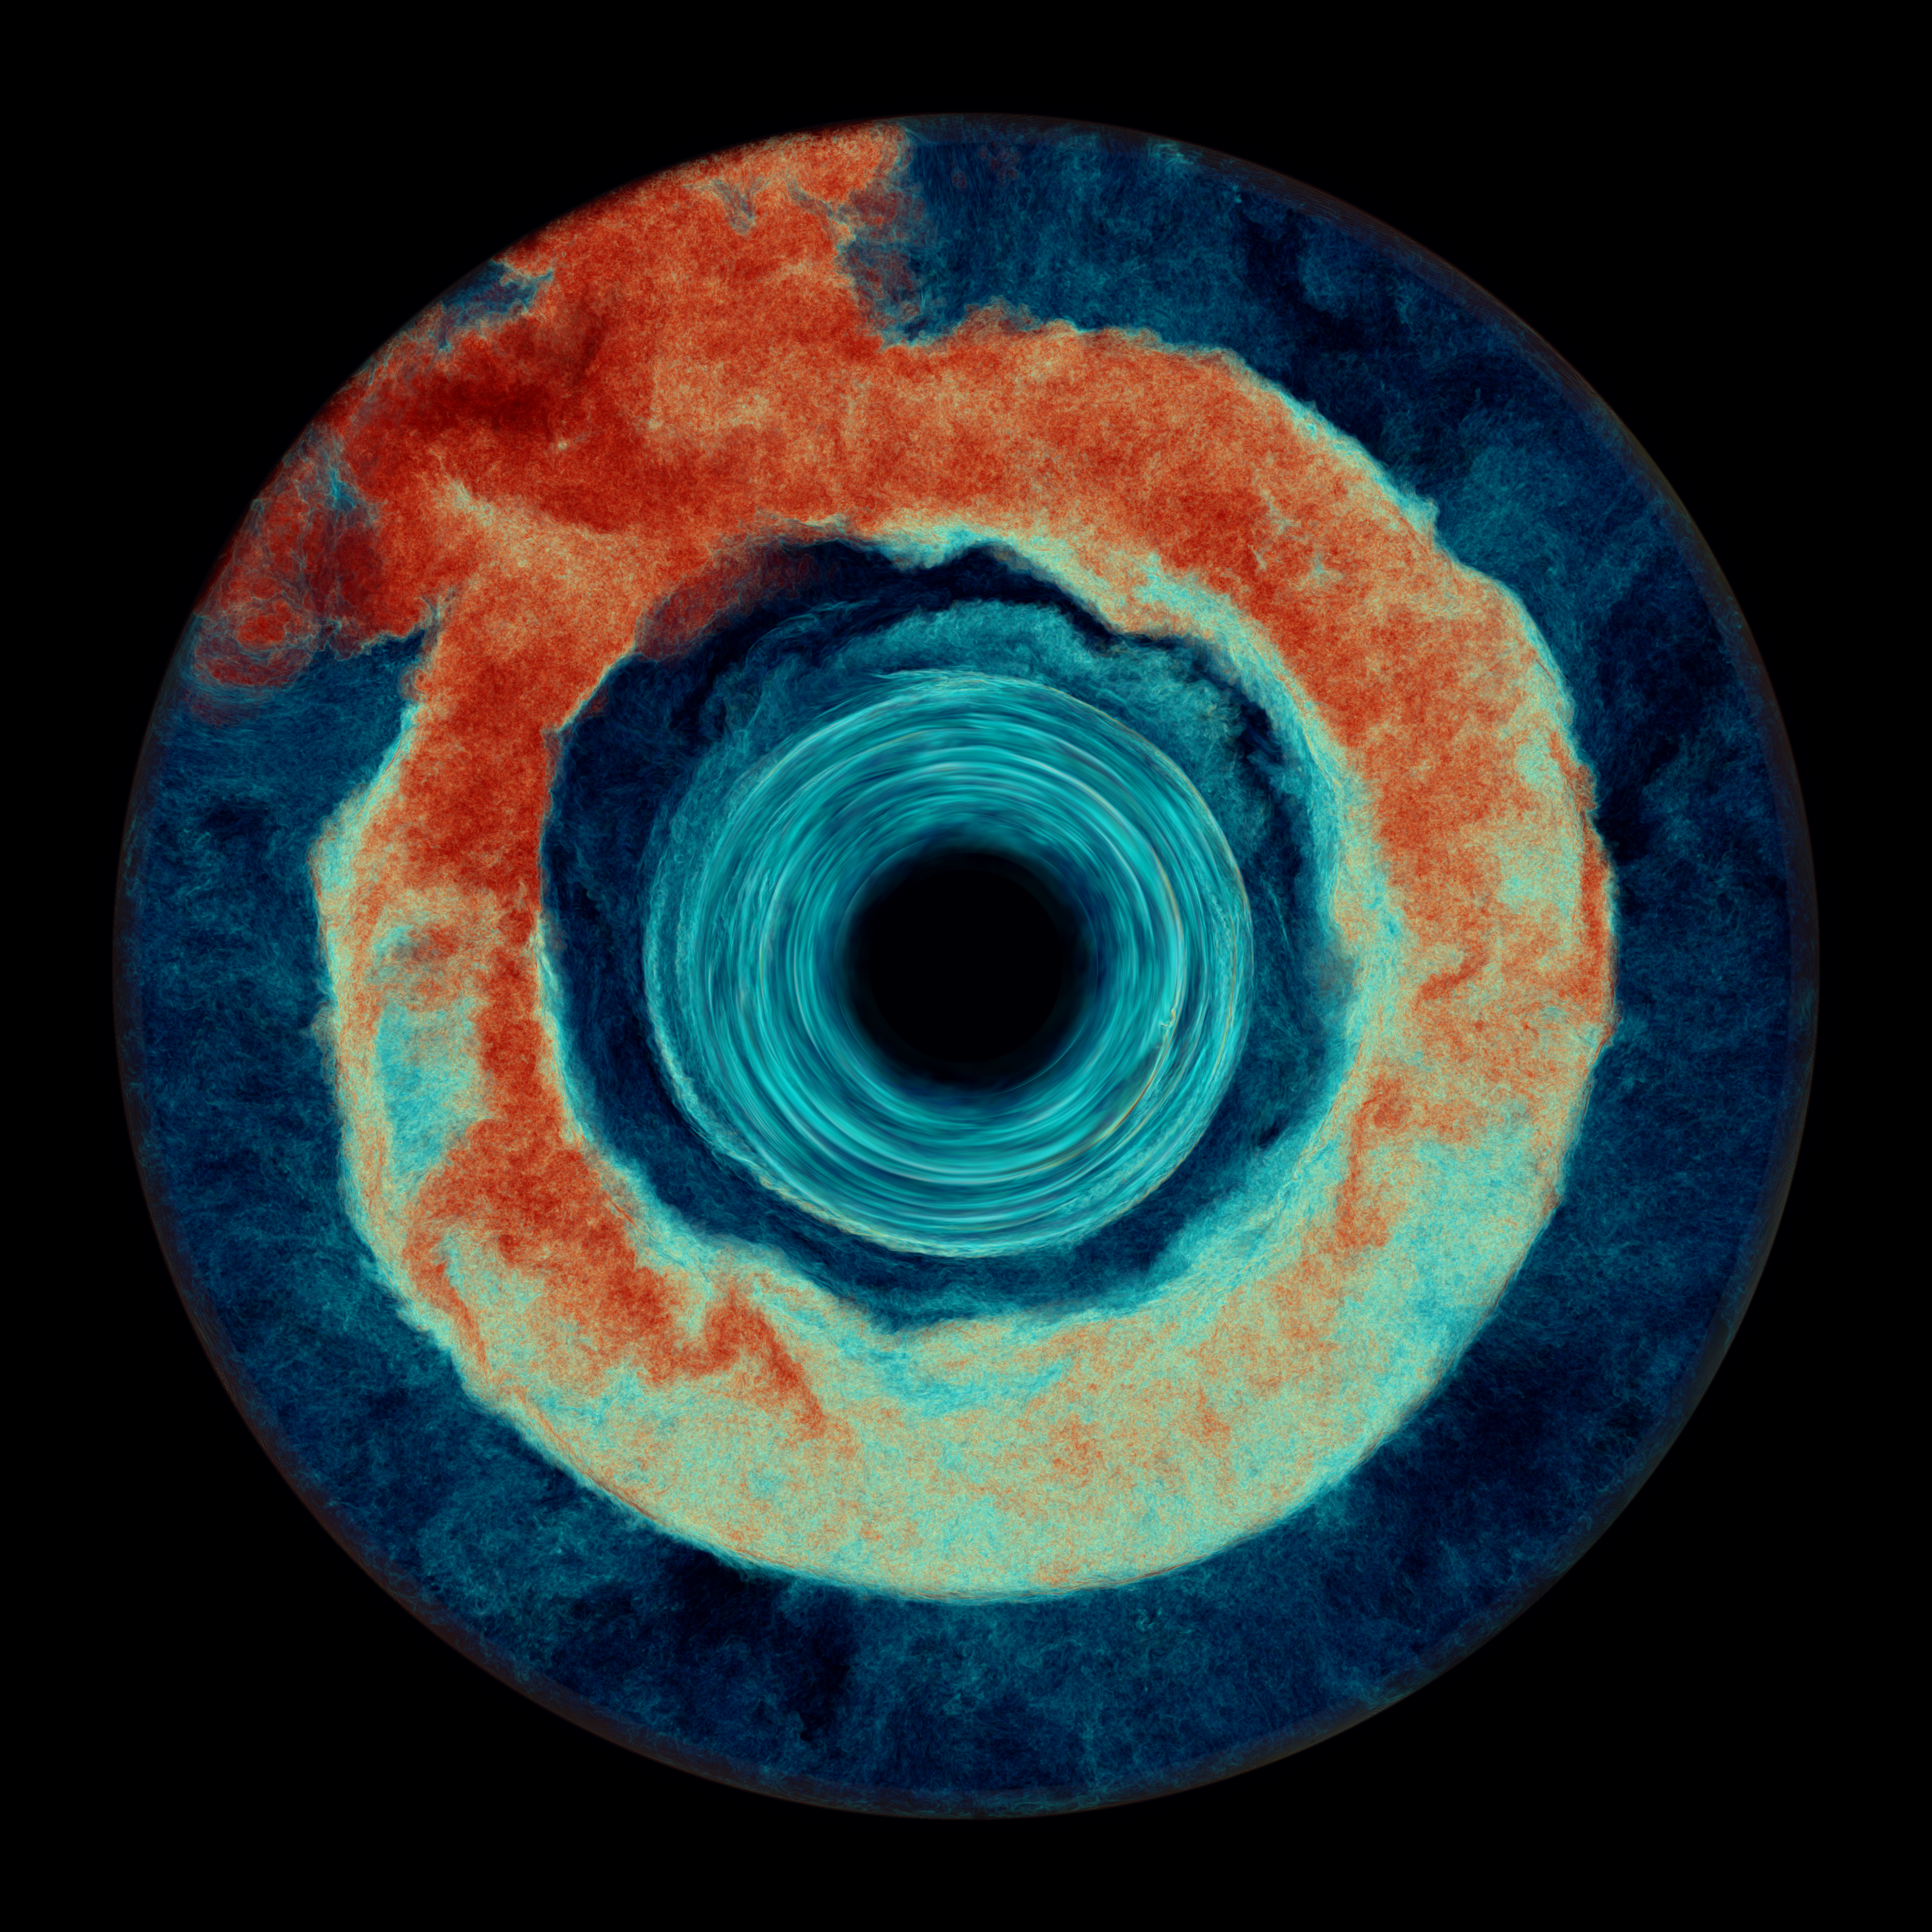
In the case of the Population-III AGB star that we study in our Frontera simulation, the stably stratified gas above the helium shell convection zone is rich in hydrogen, while the gas of that convection zone is devoid of hydrogen. The convection flow can carry small concentrations of hydrogen down to depths where the temperature is so much higher that the hydrogen will burn almost immediately by reacting with the plentiful 12C to form 13N, which subsequently beta decays to 13C. This 13C then can react with the plentiful 4He in the convection zone to produce 16O and a neutron. This source of neutrons sets in motion a chain of neutron capture reactions that can build up heavier elements in what has been called i-process nucleosynthesis. More energy can be released in this process than in the helium burning at the base of the convection zone, giving rise to a hydrogen ingestion flash. In our simulation, we implement a temperature correction in order to have the hydrogen burn at the proper depth in the convection zone. At those depths, about 2/3 of the way to the bottom of the convection zone, the localized energy release produces strong updrafts that result in still more hydrogen-rich gas being carried down. This positive feedback leads to a global oscillation of shell hydrogen ingestion (GOSH) event [12] that ultimately disrupts the region of the star under study. This is shown in the sequence of images in Fig. 3.
Rapid initiation of the 3-D convection flow. In this simulation, we wanted to use the special opportunity to run on the entire Frontera machine to enable us to run at very high grid resolution. However, doing that requires that we take a great many time steps. Each time that we multiply by 8 the number of grid cells updated by each node, we also multiply by 2 the number of time steps required to carry the simulation forward by a given amount of time for the star. If we try to get the number of time steps down by assigning fewer grid cells to each node, then we risk reaching a point at which the machine's interconnect is no longer able to deliver the messages fast enough between nodes so that they have always arrived by the time they are needed. The size of the grid and the size of the machine therefore pose an optimization problem for us. There is a minimum grid size that can run at "full speed" on any given machine. This minimum grid size can be influenced by the code design, of course. For our PPMstar code and the Frontera machine, we decided that the 38403 grid that we used for our large runs was likely to be fairly close to the minimum grid that could fully exploit the machine. The simulation in Figs. 1-6 ran for 1,859,382 time steps at a rate of 15.9 steps per second. We took special measures to see that we used these time steps well. We initialize the problem with a fit to a result from a 1-D stellar evolution calculation. Therefore we start the simulation in a spherically symmetric state. This initial state is considered an unperturbed state of the star, and we subtract it out from the dynamical equations. We do not linearize the resulting perturbation equations; they remain fully nonlinear. The flow is driven by our introduction of heat from helium burning at the base of the lower convection zone (which begins on a single adiabat) and cooling at the top of the upper convection zone to represent the transfer of heat outward to the rest of the star from the top of our simulation domain. We rely on the convective instability to initiate flow, developing from tiny perturbations that inevitably result from performing the calculation on a uniform Cartesian grid. In this simulation, we experimented with driving the flow very strongly with a heightened rate of heating for a brief initial period, then dropping the heating rate back down to a constant, much lower level. Our idea was to get the convection going as rapidly as possible, without driving the flow so hard that its character would substantially change. We simply wanted to speed it up and get through its initial transient adjustment to the freedom of 3 dimensions quickly. The heating rate that drives the lower convection zone began at 5000 times the luminosity of the star in the 1-D stellar evolution calculation. After 16 dump intervals, we dropped this down to a constant level of 100 times the nominal luminosity of the star. The cooling rate at the top of the simulation volume remained at 100 times the luminosity of the star in the 1-D model throughout the 3-D simulation. Years of experience with this sort of 3-D simulation have consistently shown (cf. [16,5]) that when we multiply the driving luminosity of turbulent convection by a factor F, the average velocity magnitude in the convection zone is increased by a factor F1/3, as long as the flow speed remains well below the speed of sound. We have also found that the rate at which gas from above the convection zone becomes entrained in the convection flow is increased by a factor F. These two empirically determined scaling relationships can be understood as follows. If we say that the fraction of the total energy flux that is represented by the kinetic energy flux is invariant under the luminosity enhancement by the factor F, and if the convection flow is fully turbulent, so that the average magnitudes of all 3 components of the vector velocity are essentially equal, then the flow speed should increase by a factor F1/3. These two statements are likely to be true as long as F is not so large that the basic character of the convection flow is altered (cf. [17]). If we say that the amount of the stably stratified gas that is entrained and mixed into the convection zone is linearly proportional to the energy available to perform this mixing (which requires that displaced denser fluid be lifted against gravity), then we would expect the entrainment rate to scale with F (cf. [18]). This argument is likely to be true as long as F is not so large that the basic character of the flow is altered, and if in addition the entrainment process has essentially no dependence on the details of fluid instabilities near the convective boundary. In our large simulations on Frontera, our increase of the driving luminosity by a factor of 100 therefore should make the entrainment process that leads to the hydrogen ingestion flash run 100 times faster, but it should not change the character of that flash outburst. It should increase the Mach number of the simulated flow by a factor of 4.64, and we would expect the increased momentum of the convection plumes reaching the convective boundary to distort that spherical surface 4.64 times as greatly also. (We observe this scaling behavior also in similar flows [5].) This speed up of the flow brings maximum Mach numbers that we encounter up to a level of about 0.1, and this number roughly doubles when strong feedback from burning of ingested fuel in the convection zone gets going late in our simulation. These flow speeds are still quite subsonic, and we believe that they do not fundamentally alter the character of the convection flow. In the initial transient phase of the simulation, when we get the turbulent convection flow started, we push velocities up further by an additional factor of 3.68. Nevertheless, the maximum Mach number that we encountered in this phase of the flow was 0.182. Hence we keep our convection flow always safely very subsonic, although not extremely subsonic. Average Mach numbers are of course considerably more modest, remaining below 0.02 at most radii most of the time before the final outburst shown in Figs. 3g-i.
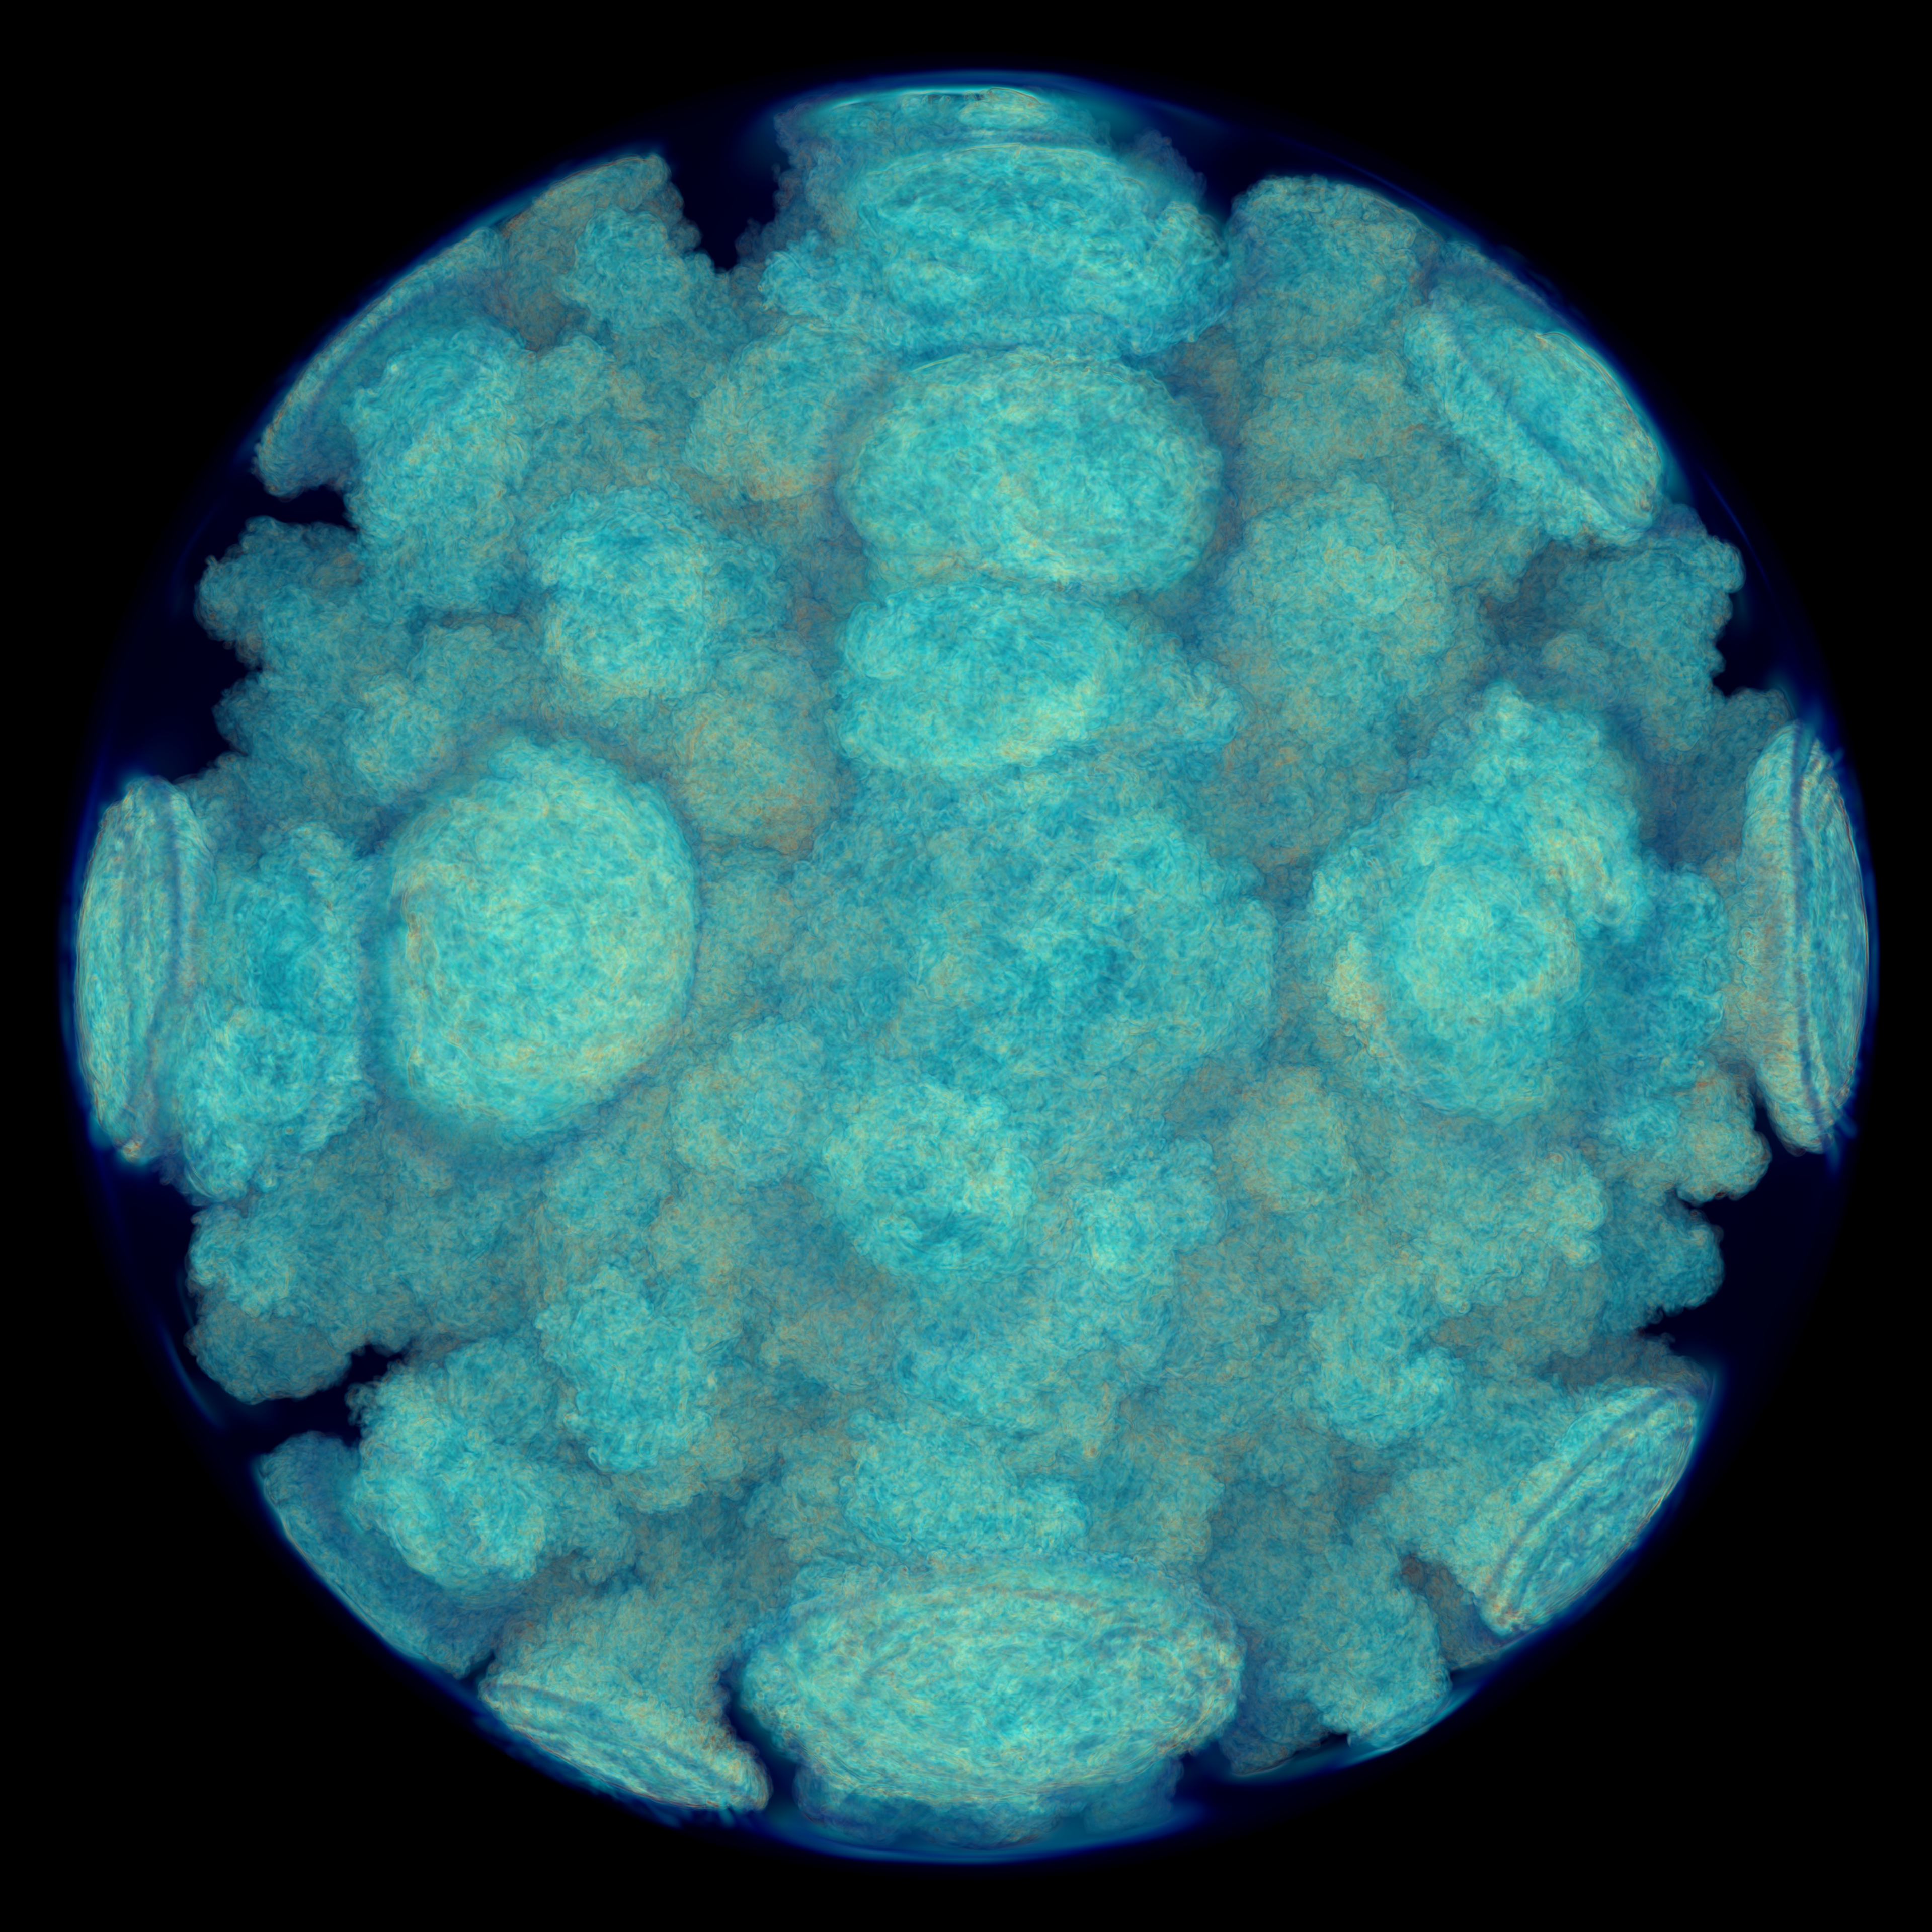
In Fig.4, the flow in the lower convection zone is seen at dump 20, 4 dumps after the driving luminosity was brought down to its subsequently constant level. It is evident that rising plumes are just striking the upper convective boundary. They are clearly not striking this boundary violently, since they are spreading out horizontally upon meeting the convective boundary without perceptively distorting that spherical surface. At dump 20 we observe the maximum Mach number, 0.182, and the maximum Mach number in the flow drops thereafter to around 0.08 by dump 32. We have consumed only a tenth of the running time to complete the initiation of the turbulent convection flow in this way. From Fig. 4 it is clear that the flow is fully turbulent, and it becomes statistically steady in the convection zone by around dump 50. This can be seen by examining moving time averages of the radial profiles of total energy flux. This flow initiation process can be observed in movies we have made of volume renderings of the vorticity magnitude (cf. www.lcse.umn.edu).
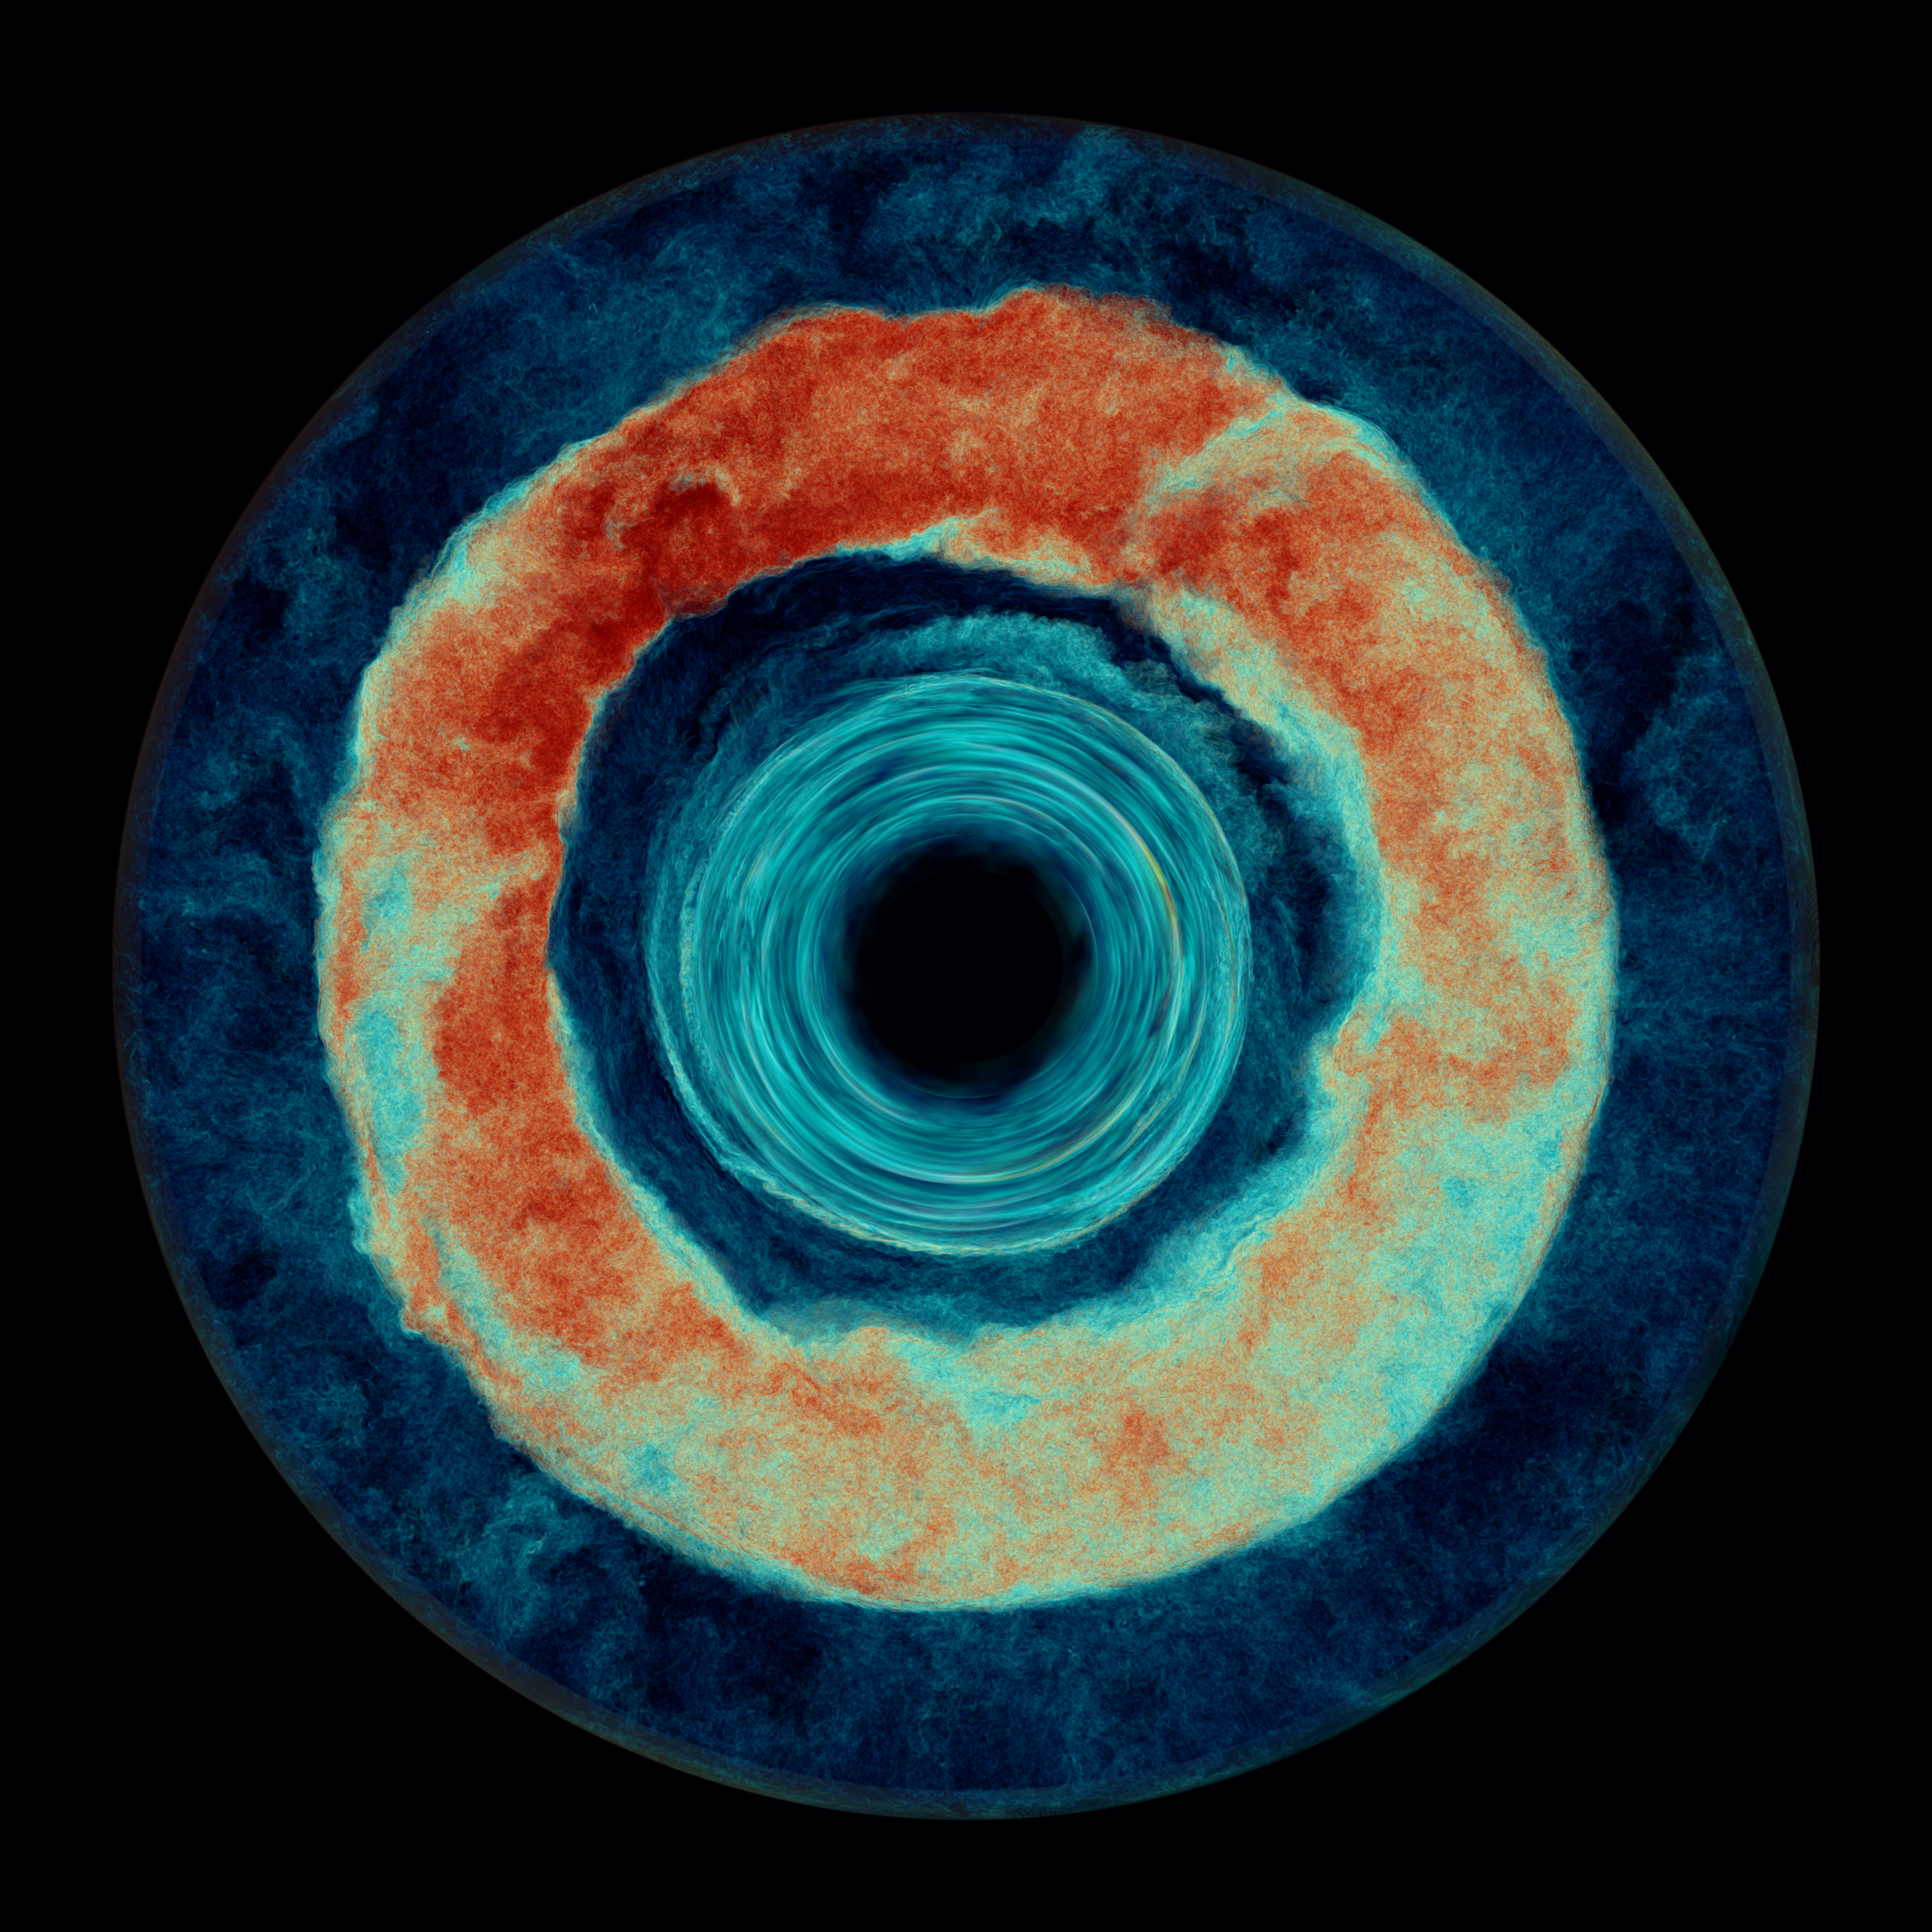
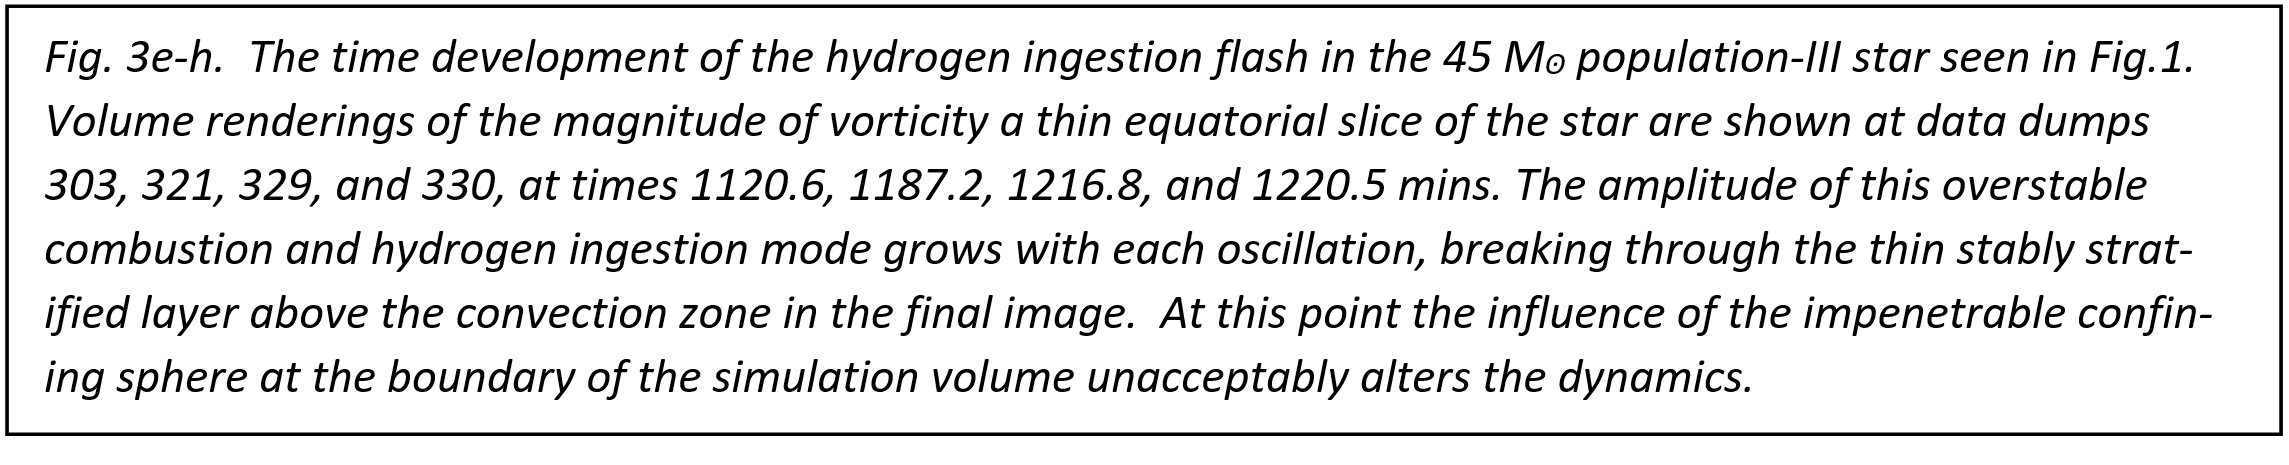
The specific focus of this very highly resolved simulation on Frontera is the detailed interaction of the convection flow with the thin stably stratified layer separating this star's convection zones above its helium and hydrogen burning shells. The level of detail in the flow field in this simulation is evident in the zoomed-in images in Figs. 5 and 6. We computed the hydrogen burning using a temperature correction to account for the effects of radiation pressure that were omitted in this simulation code's treatment of the equation of state. This correction caused the ingested hydrogen to burn at the proper depth in the lower convection zone, producing the intermittent, localized bursts of energy release that strongly enhance the further ingestion of hydrogen-rich gas from above the lower convection zone. This is an inherently 3D effect that demands our fully 3-D numerical treatment. In the vorticity images of Fig. 3, which show the development of a GOSH (Global Oscillation of Shell Hydrogen ingestion) event in the lower convection zone, the localized bursts of energy input from burning ingested fuel are marked by especially intense regions of vorticity. It is important that the ingested fuel cannot reach the bottom of the convection zone before the heat increase with depth raises its reaction rate so high that it burns immediately, before it can descend further. This enhances the effect of the local updraft that is caused by its burning and thus increases the nonlinear feedback that drives more fuel entrainment. Because the rate of fuel entrainment scales linearly with the luminosity, the ratio of this local energy release to the energy input further down from helium burning remains unchanged. The process is speeded up; it is not changed in character. One might think that the scaling of the convection velocities with the 1/3 power of the luminosity might cause the fuel to burn at a different depth, but this is not the case. The depth at which the fuel burns depends essentially entirely upon the unperturbed temperature structure of the star, which is unchanged by our enhancement of the luminosity. This is a result of the extreme temperature sensitivity of the nuclear reactions involved. In Fig. 3i, the concentration of the gas from above the lower convection zone is shown at dump 331, at the end of the computation. The amplification of the overstable burning in the GOSH event has caused some of the material from the lower convection zone to punch through the thin stable layer into the convection zone above. Our bounding sphere strongly affects the flow at this time. However, with the fine grids that Frontera enables with our PPMstar code, we will be able in future work to move this bounding sphere outward, so that more realistic behavior at this late stage of the GOSH should result.
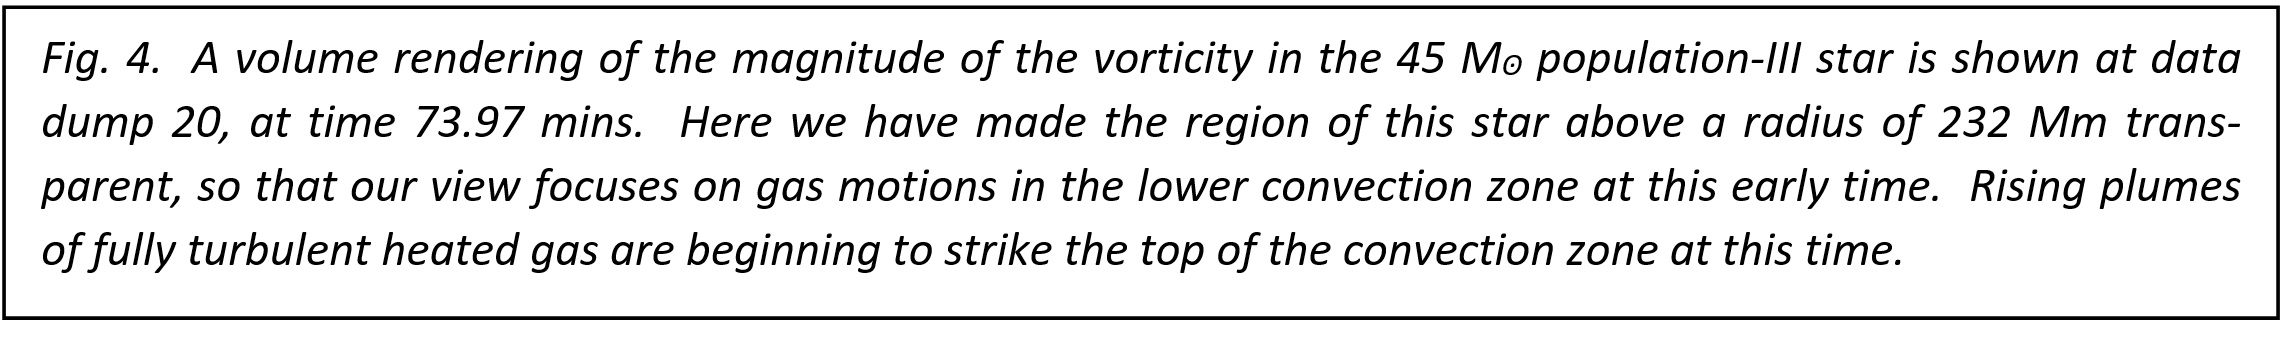
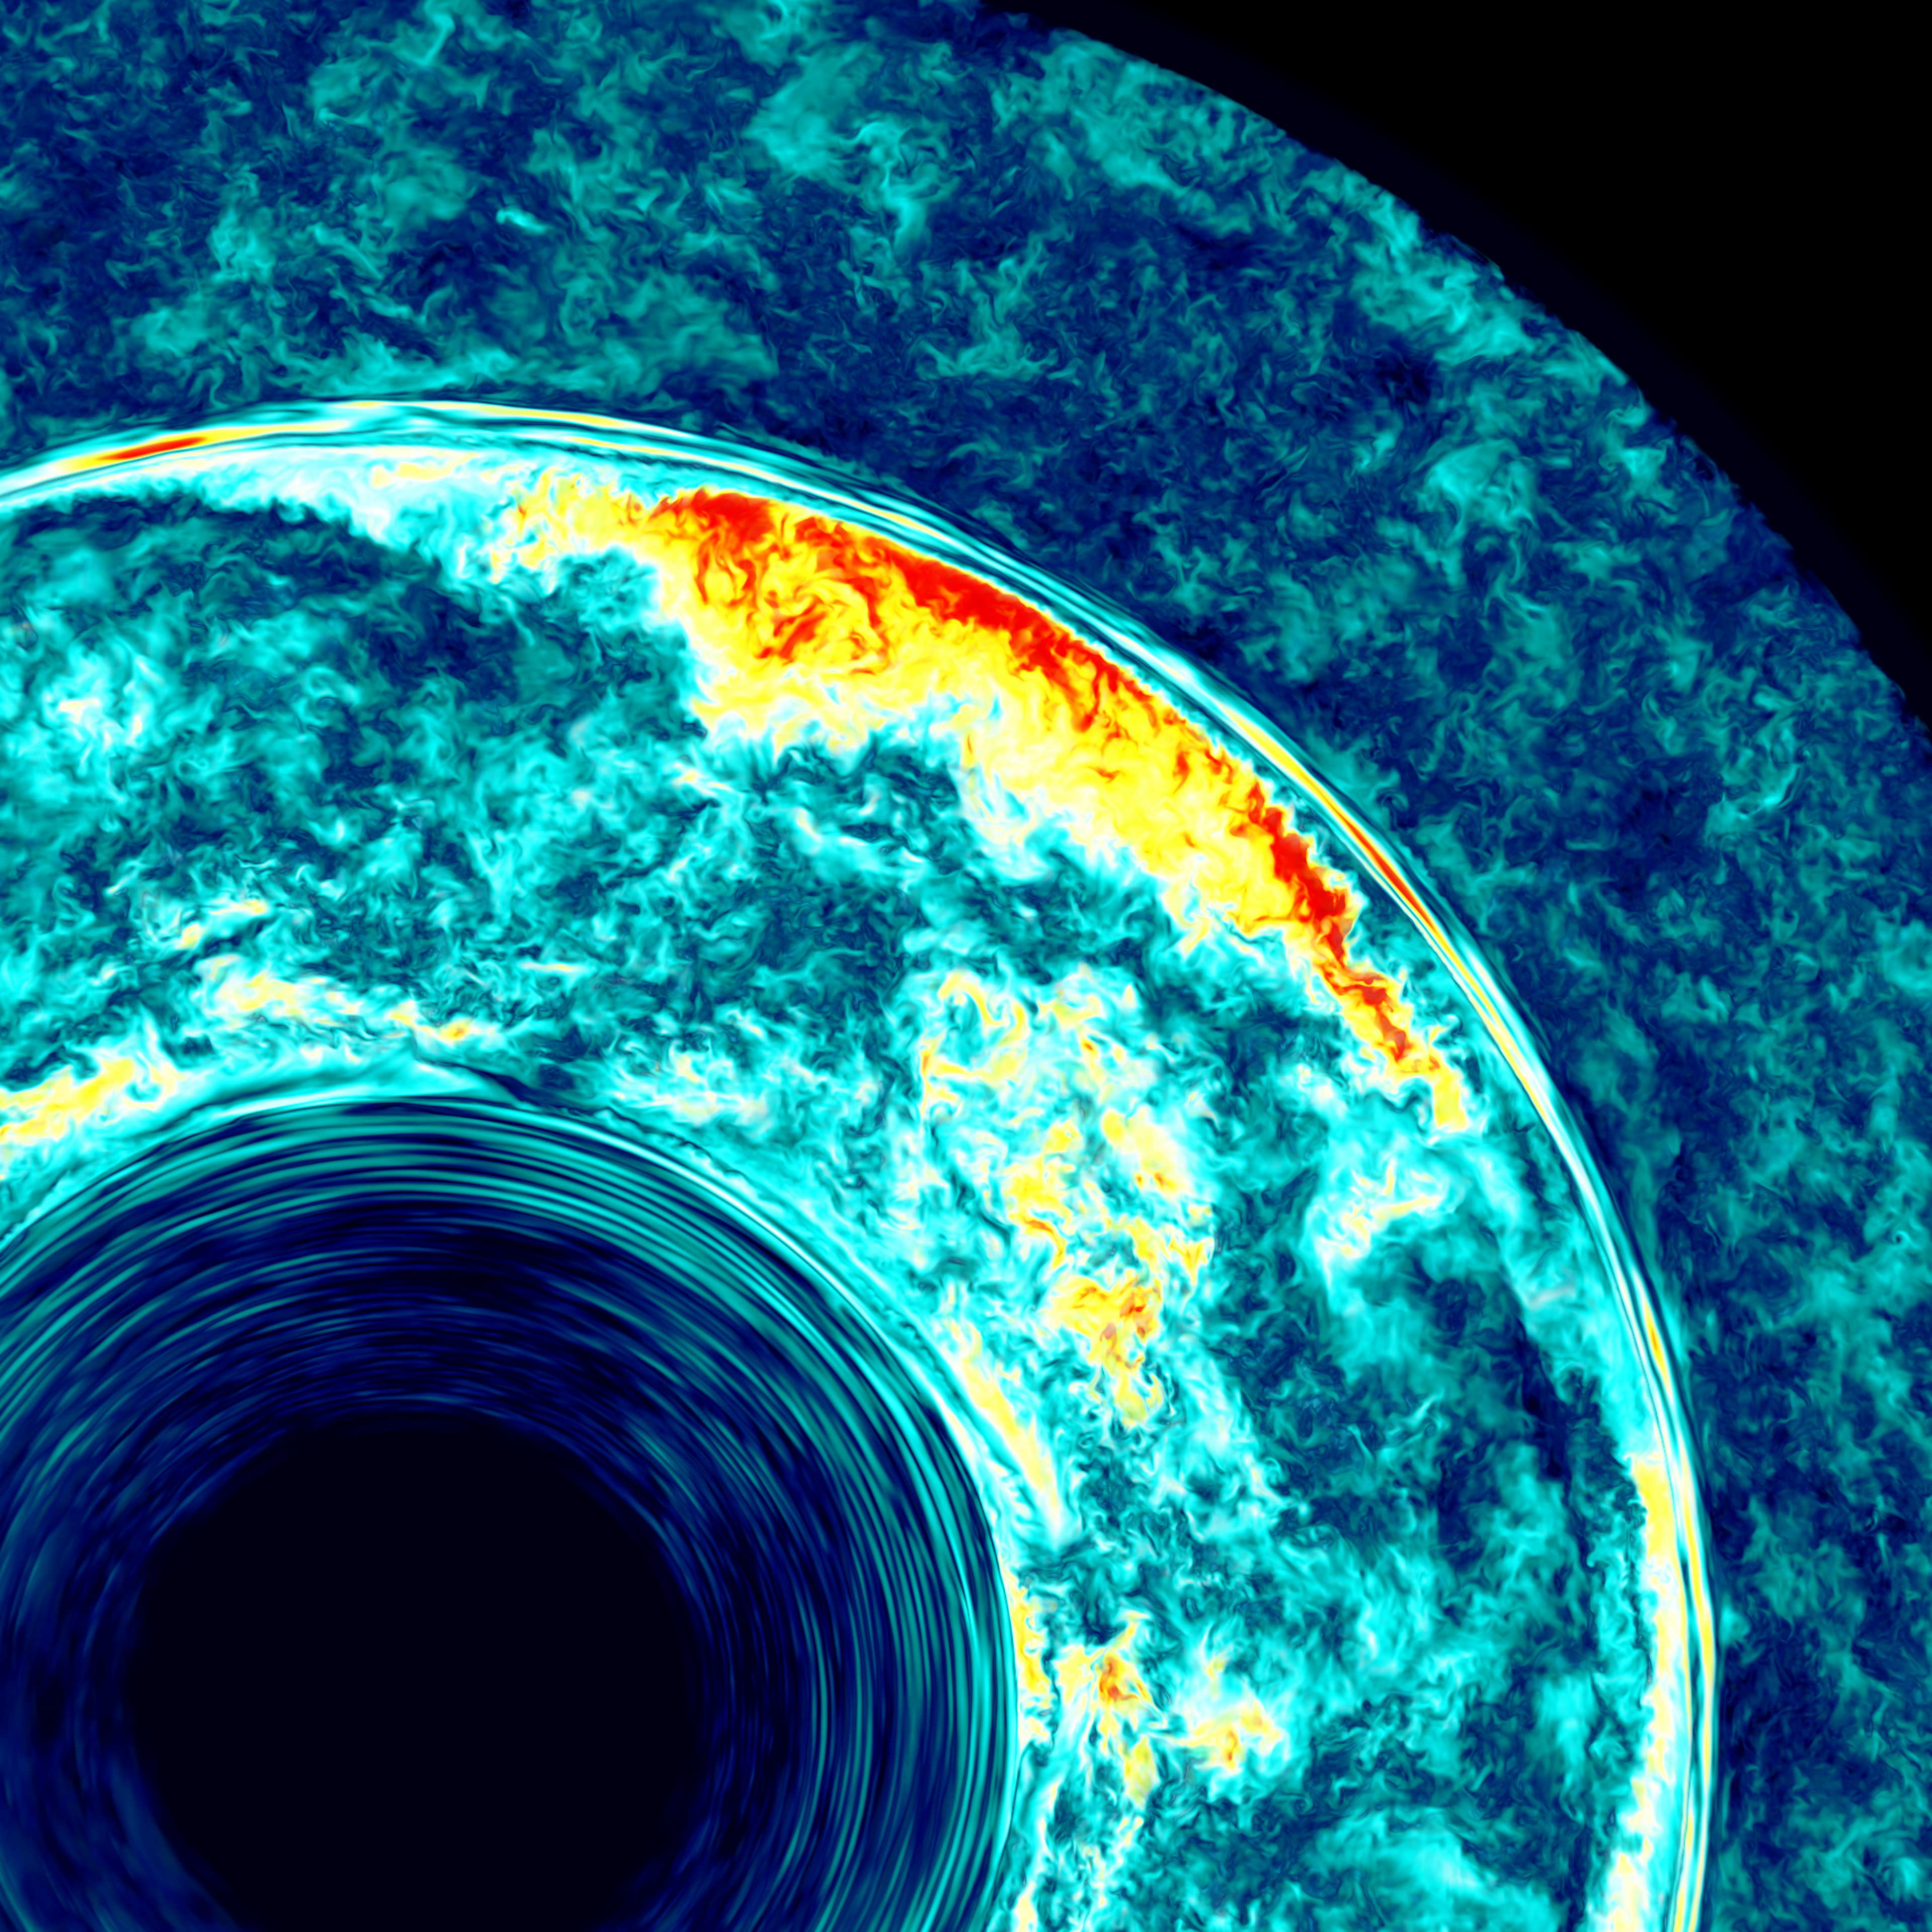
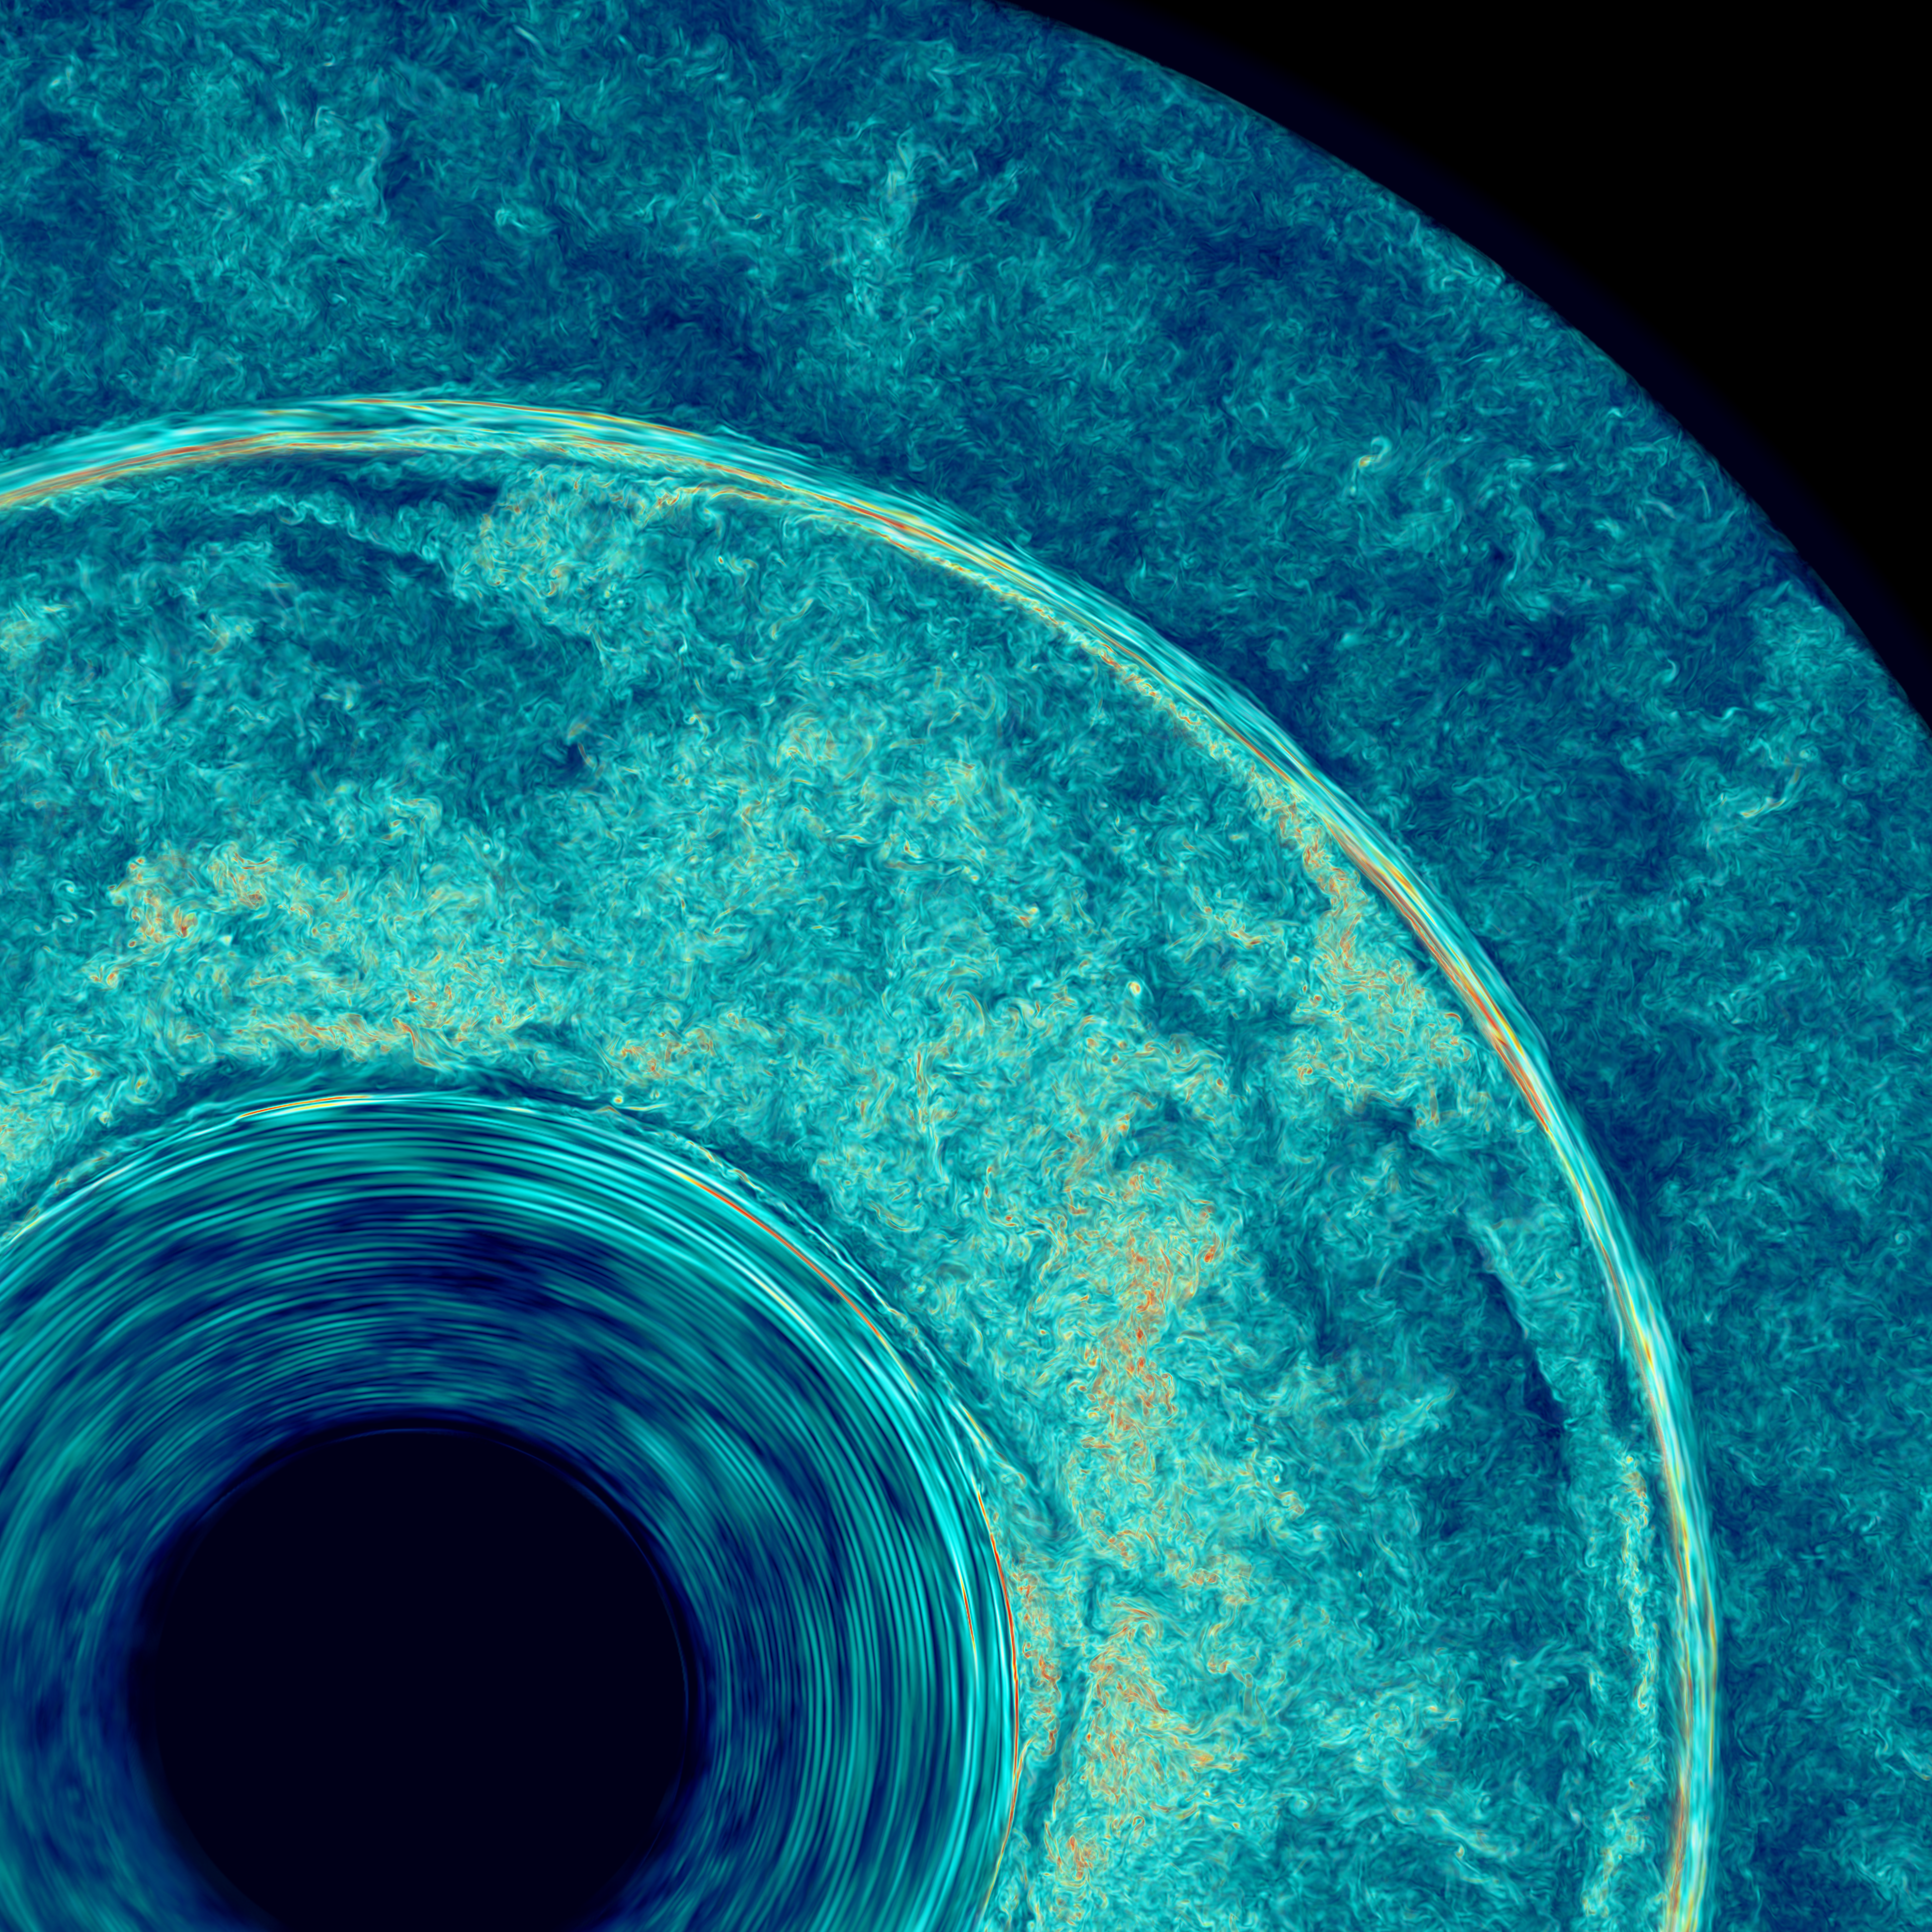
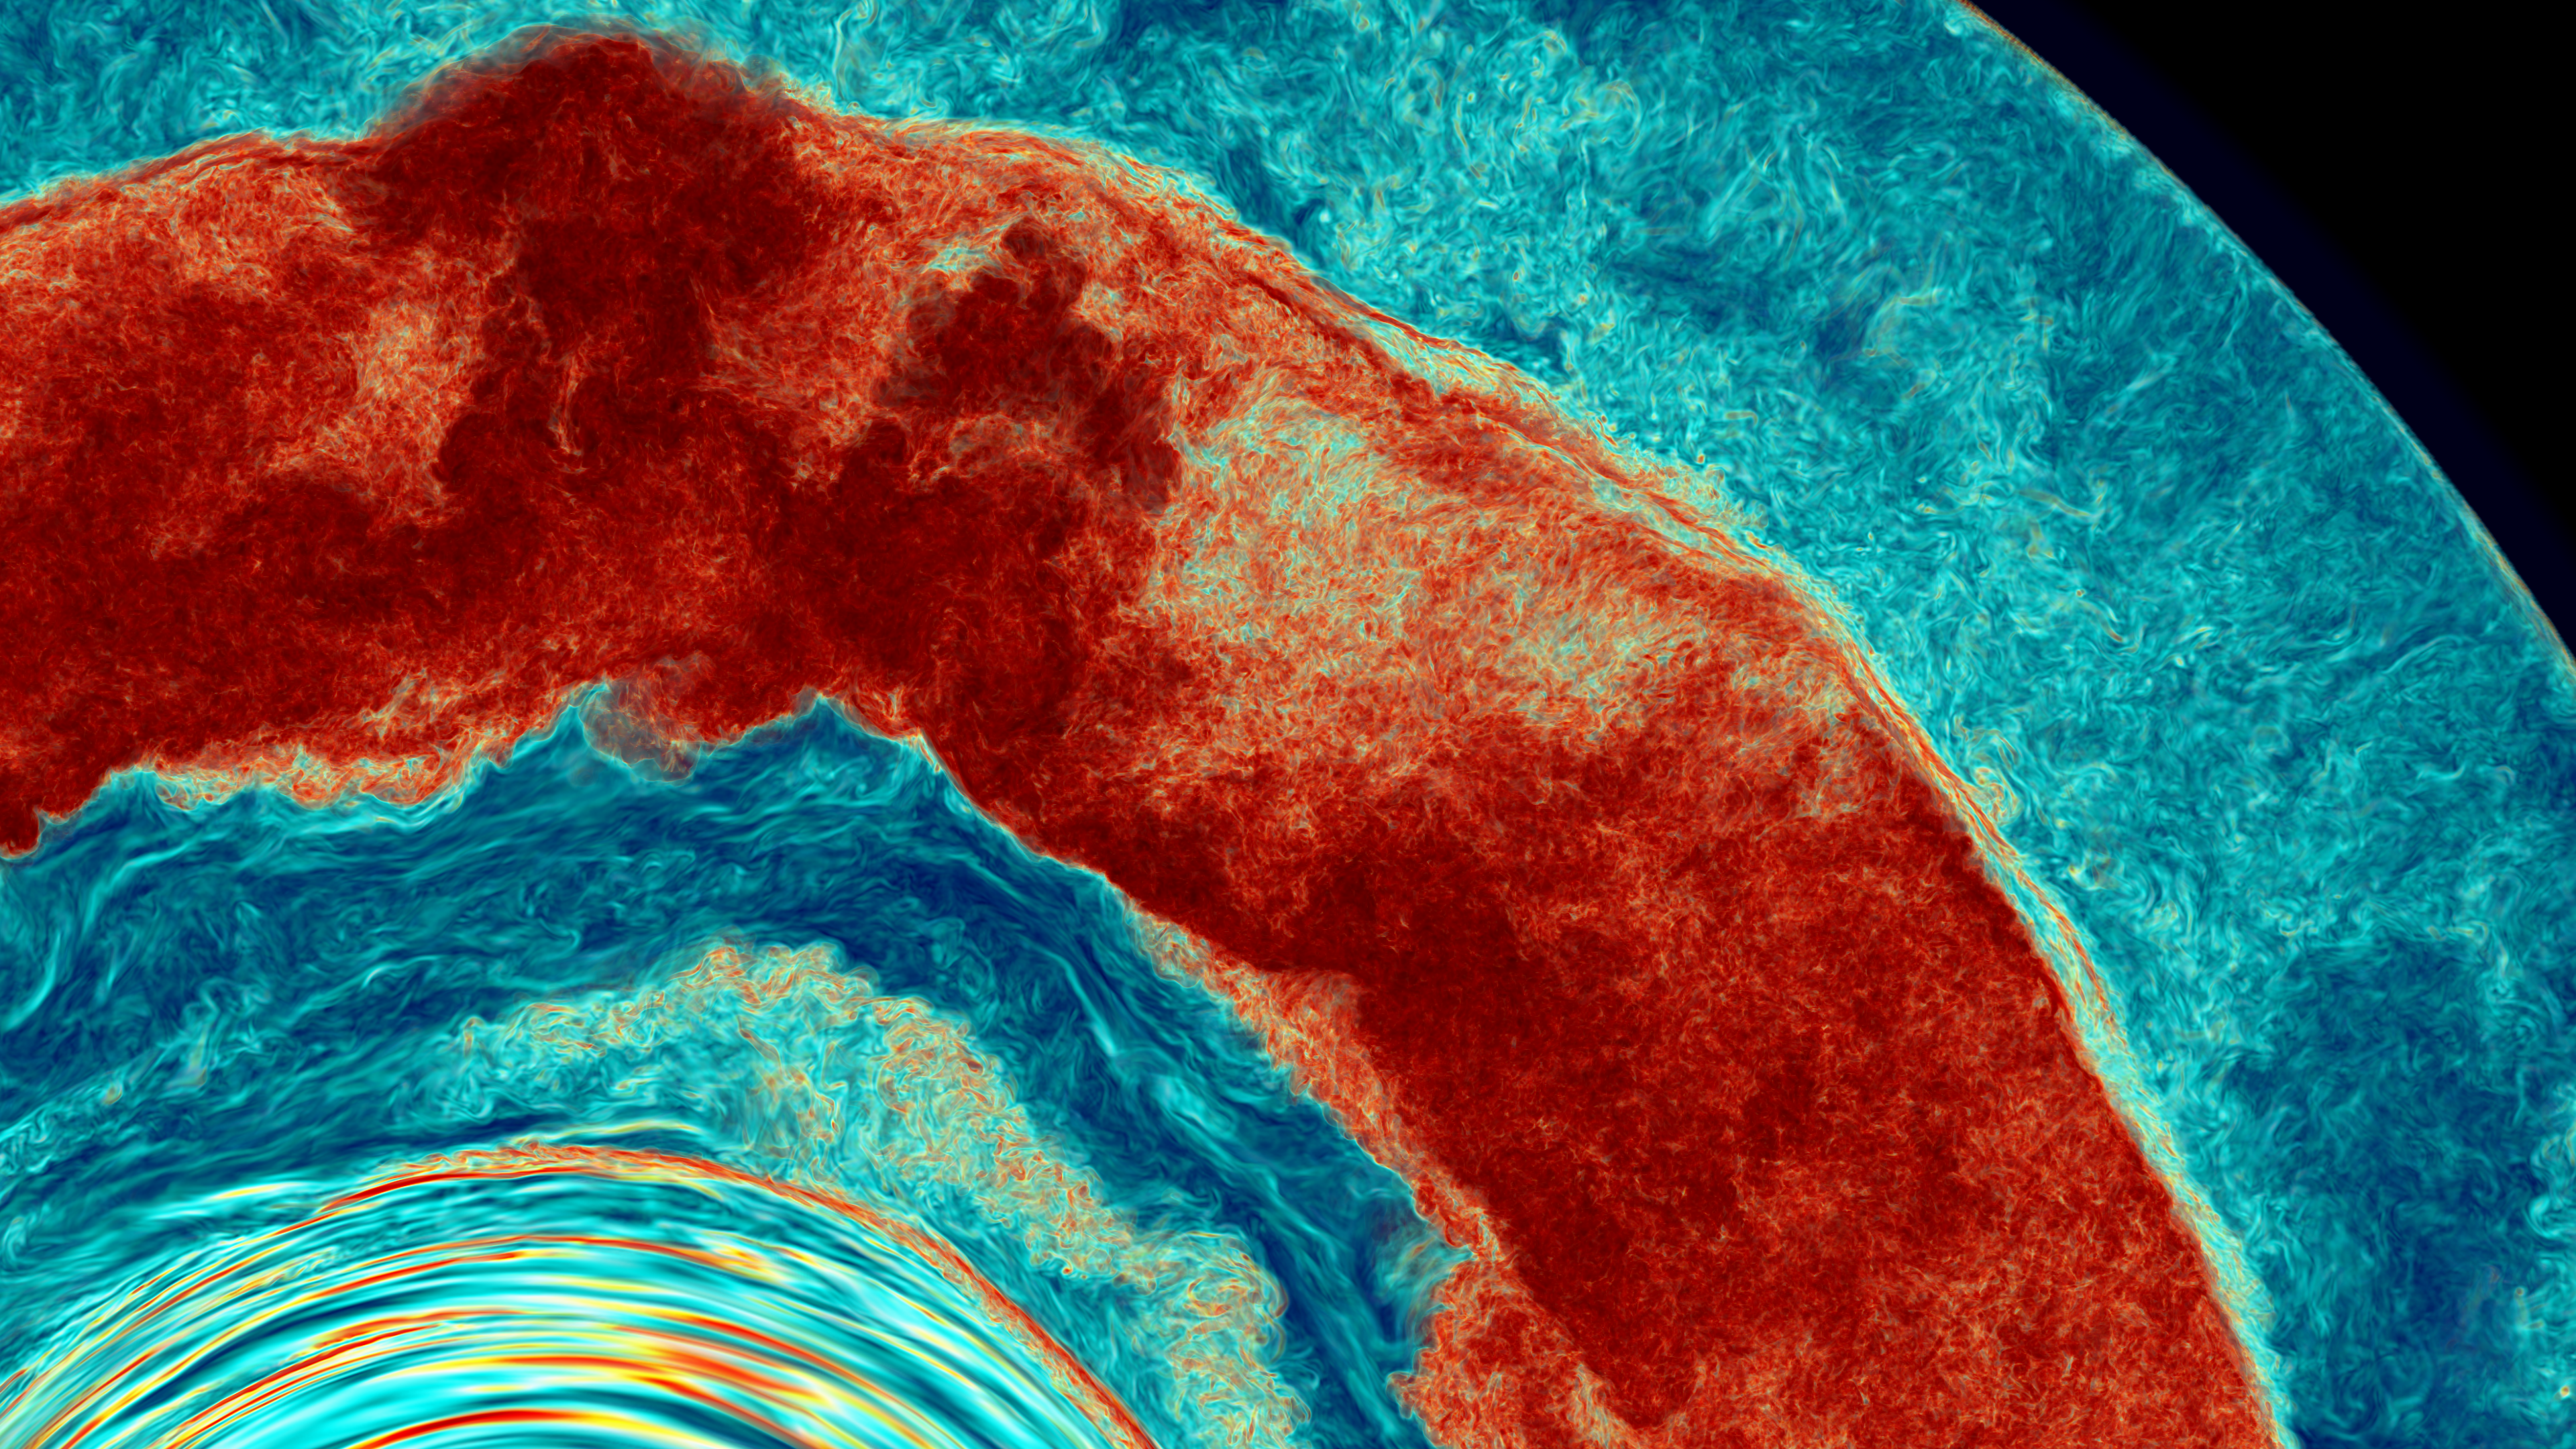
The grid in this simulation is so fine that we can zoom in close to the thin layer of stably stratified gas separating the two convection zones to observe its interactions with the increasingly violent energy release from the burning of entrained gas. In Fig. 6, we see volume renderings of the vorticity magnitude in a thin slice through the center of the star. In Fig. 6a, at 832 min., the stable layer is clearly traced by a thin line of very strong vorticity (hence shear) at its lower surface. The layer is of constant thickness through this image, and is very nearly spherical. In Fig. 6b, at 1017 min., the turbulent convection in the lower convection zone has become more violent, and a small distortion of the stable layer is now evident near the center of the image. In Fig. 6c, at 1147 min., a wave of disturbed gas can be seen traveling around the stable layer and just above it, like a tsunami. In Fig. 6d, at 1213 min. we see this region of the thin, stably stratified shell at a moment when the spherical focusing of wave energy associated with the GOSH event causes material to force the stable layer outward significantly near the upper left in the image. Use of our simulation results in convergence studies and code comparisons. Our team's project on Frontera is investigating how convective boundary mixing can result in the disruption of thin stably stratified layers like the one in this model star, which can ultimately result in the merger of the two burning shells with as yet unknown results for the structure and nucleosynthesis of the star. Our two simulations in October on Frontera - one with nuclear burning feedback and one without it and both carried out at unprecedented grid resolution - are helping us to quantify the accuracy we can achieve in this sort of very complex situation on this powerful machine. With this quantitative information, we can more confidently proceed to elucidate the process of burning shell mergers in massive stars in further work as we enhance our simulation code. The simulation without burning of ingested fuel helps us to validate less highly resolved simulations of the rate at which a convection zone advances into stably stratified gas that does not contain combustible fuel, and the simulation with the burning included helps us to validate less well resolved simulations of such a convection zone advance into fuel-bearing layers. Both processes play an important role in burning shell mergers. In addition to these benefits for our own research, we can turn the more simplified and robust construction of the code that we used for these runs to advantage by making this detailed simulation data available to the community in an easily explorable form. This data can then be used to establish these simulations as formal community test problems against which the results of multiple codes embodying different computational techniques, running at lower and more easily affordable grid resolutions, can be quantitatively compared. Managing and sharing the simulation data. These very large runs generated about 0.5 PB of simulation data. We have been working with this data on Frontera over the last month, but of course it is impractical to leave all this data on the system's disks for too long. Our code automatically generates 4 different types of data products as it runs. First, of course, are restart dumps. These are extremely large, but without them we cannot restart a run that has been interrupted for whatever reason. We generally save only a handful of these, and for only a limited time. About an order of magnitude more frequently, the code also dumps out visualization dumps. These consist of single-byte color level data for 10 different variables, with one byte per grid cell. For the mixing fraction of the tracked fluid, the gas originally above the lower convection zone, we dump out tis visualization data at double the grid resolution, because our PPB advection scheme computes 10 independent moments of this variable in each cell and therefore offers true subcell resolution. These visualization dumps allow us to go back after the run and visualize any of the ten variables in any desired fashion, but of course we cannot change the mapping that was used in the run from variable values to color levels. We find it useful, if possible, to keep these dump files for 3 or 4 of the variables for up to a year, or even two years. These files, because of the limited number of color levels, tend to compress well, so that keeping them is practical. However, compressing and decompressing these files is a tedious undertaking. It requires a wall clock time comparable to the run itself to compress and tar up these files into convenient chunks for long-term storage. For our convenience, we have the simulation produce default visualizations of all ten variables at each visualization dump time level. For our two very large runs here, we had 331 and 173 such time levels, with the smaller number for the shorter run that had the burning of ingested gas turned off. These visualizations can be produced at very high pixel resolution by the running code. The cost of generating these images as the code runs is essentially nothing. The images, even for a very large run, constitute essentially no data volume when compared to the visualization dumps. This is because one of the 3 dimensions of the simulation is compressed out in each image. Taking even less storage space are the radial profiles of 64 quantities that the code generates at each visualization dump time. For the present large runs, these are 2.4 MB each, consisting of eye readable tables of numbers. It is very easy to post-process the radial profile data, but of course 2 of the simulation's 3 dimensions have been compressed out in these tables. The radial profiles are invaluable for comparing with the results of implementing various alternative 1-D models in stellar evolution codes. Our code also produces a final type of output data in a highly compressed and useful form. This data is compressed onto a grid that is coarser in each of the 3 dimensions by a factor of 4. The factor of 4 might be thought too great to leave much information intact, but our experience is that this is not at all so great a loss of information as one might expect. The reason for this is that the numerical scheme must damp out very rapidly oscillating signals in order to be numerically stable. It is part of the art of numerical method design to damp out as little information as possible while still remaining stable and faithful to real signals that are being computed. Our PPM scheme performs very well from this perspective, and the PPB advection scheme that we use to track the ingested mixing fraction performs in this respect even better. Nevertheless, no numerical scheme of which we are aware can confidently produce signals with 4-grid-cell wavelengths for any significant length of time. As a result, averaging our simulation data over briquettes of 43 cells produces much less signal loss than one would expect. We could not accurately advance the briquette-averaged data in time using our numerical scheme, but we do not need to do that. Our code's briquette-averaged data is also compressed in precision. The data was computed at 32-bit precision, but this much precision is not necessary for its storage nor for its use in post-processing data analysis. Instead, we compress it into just 16 bits in a two-step process. First, we apply a nonlinear map from the real line (or from the positive half of the real line) to the finite interval from 0 to 1. Each variable has a custom nonlinear map of this type that is parameterized to capture its signal. Then the mapped values are compressed into a single byte, giving essentially color levels that can be used in visualization. A second byte representing the remainder when this color level is subtracted away is also generated. A brick of high-order bits and low-order bits is thus generated for each of 32 quantities that we select in order to give us the most useful information that we think at the time is possible in this format. This process gives an extreme data compression. We go from 16 fundamental code variables in 64 grid cells with 32-bit precision to 32 variables in 1 briquette with 16-bit precision. This compression factor is 64. The resulting files can of course be compressed further using standard techniques such as gzip. The bricks of high-order bits compress well, and the low-order bits compress less well. Our code's briquette-averaged data products are extremely convenient and useful. We require of course a complete infrastructure of tools to work with this data, and we have built them over time. The quality of this data is sufficient to form twice differentiated quantities, perform coordinate transformations, evaluate power spectra, and of course for visualization and many other types of quantitative data analysis, including the testing of assumptions of simplified statistical models. Our team has experimented in the past with sharing simulation data in this format - providing of course the data exploration tools along with the data - with other investigators. This has been most easily done when there is a project of joint interest that makes the initial investment of collaborative time worthwhile. We have also been building infrastructure for sharing this data using python and Jupyter hub technology [19]. That effort is mainly based in Victoria, with Fortran data exploration and visualization tool development based in Minnesota. An advantage of the Fortran tools is that they are all built right into the simulation code. That means that any new data analysis product that we find useful can be effortlessly added to the products the code generates automatically as it runs. Because the simulations described here are so large, we have found that it is impossible to post-process them at a practical level on fewer than 3 Frontera nodes. Rerendering can require 9 nodes, and even 27 for the double-resolution mixing fraction variable. Nevertheless, these are tiny resource requirements, given the size of the runs involved.
References.
Associated Movies 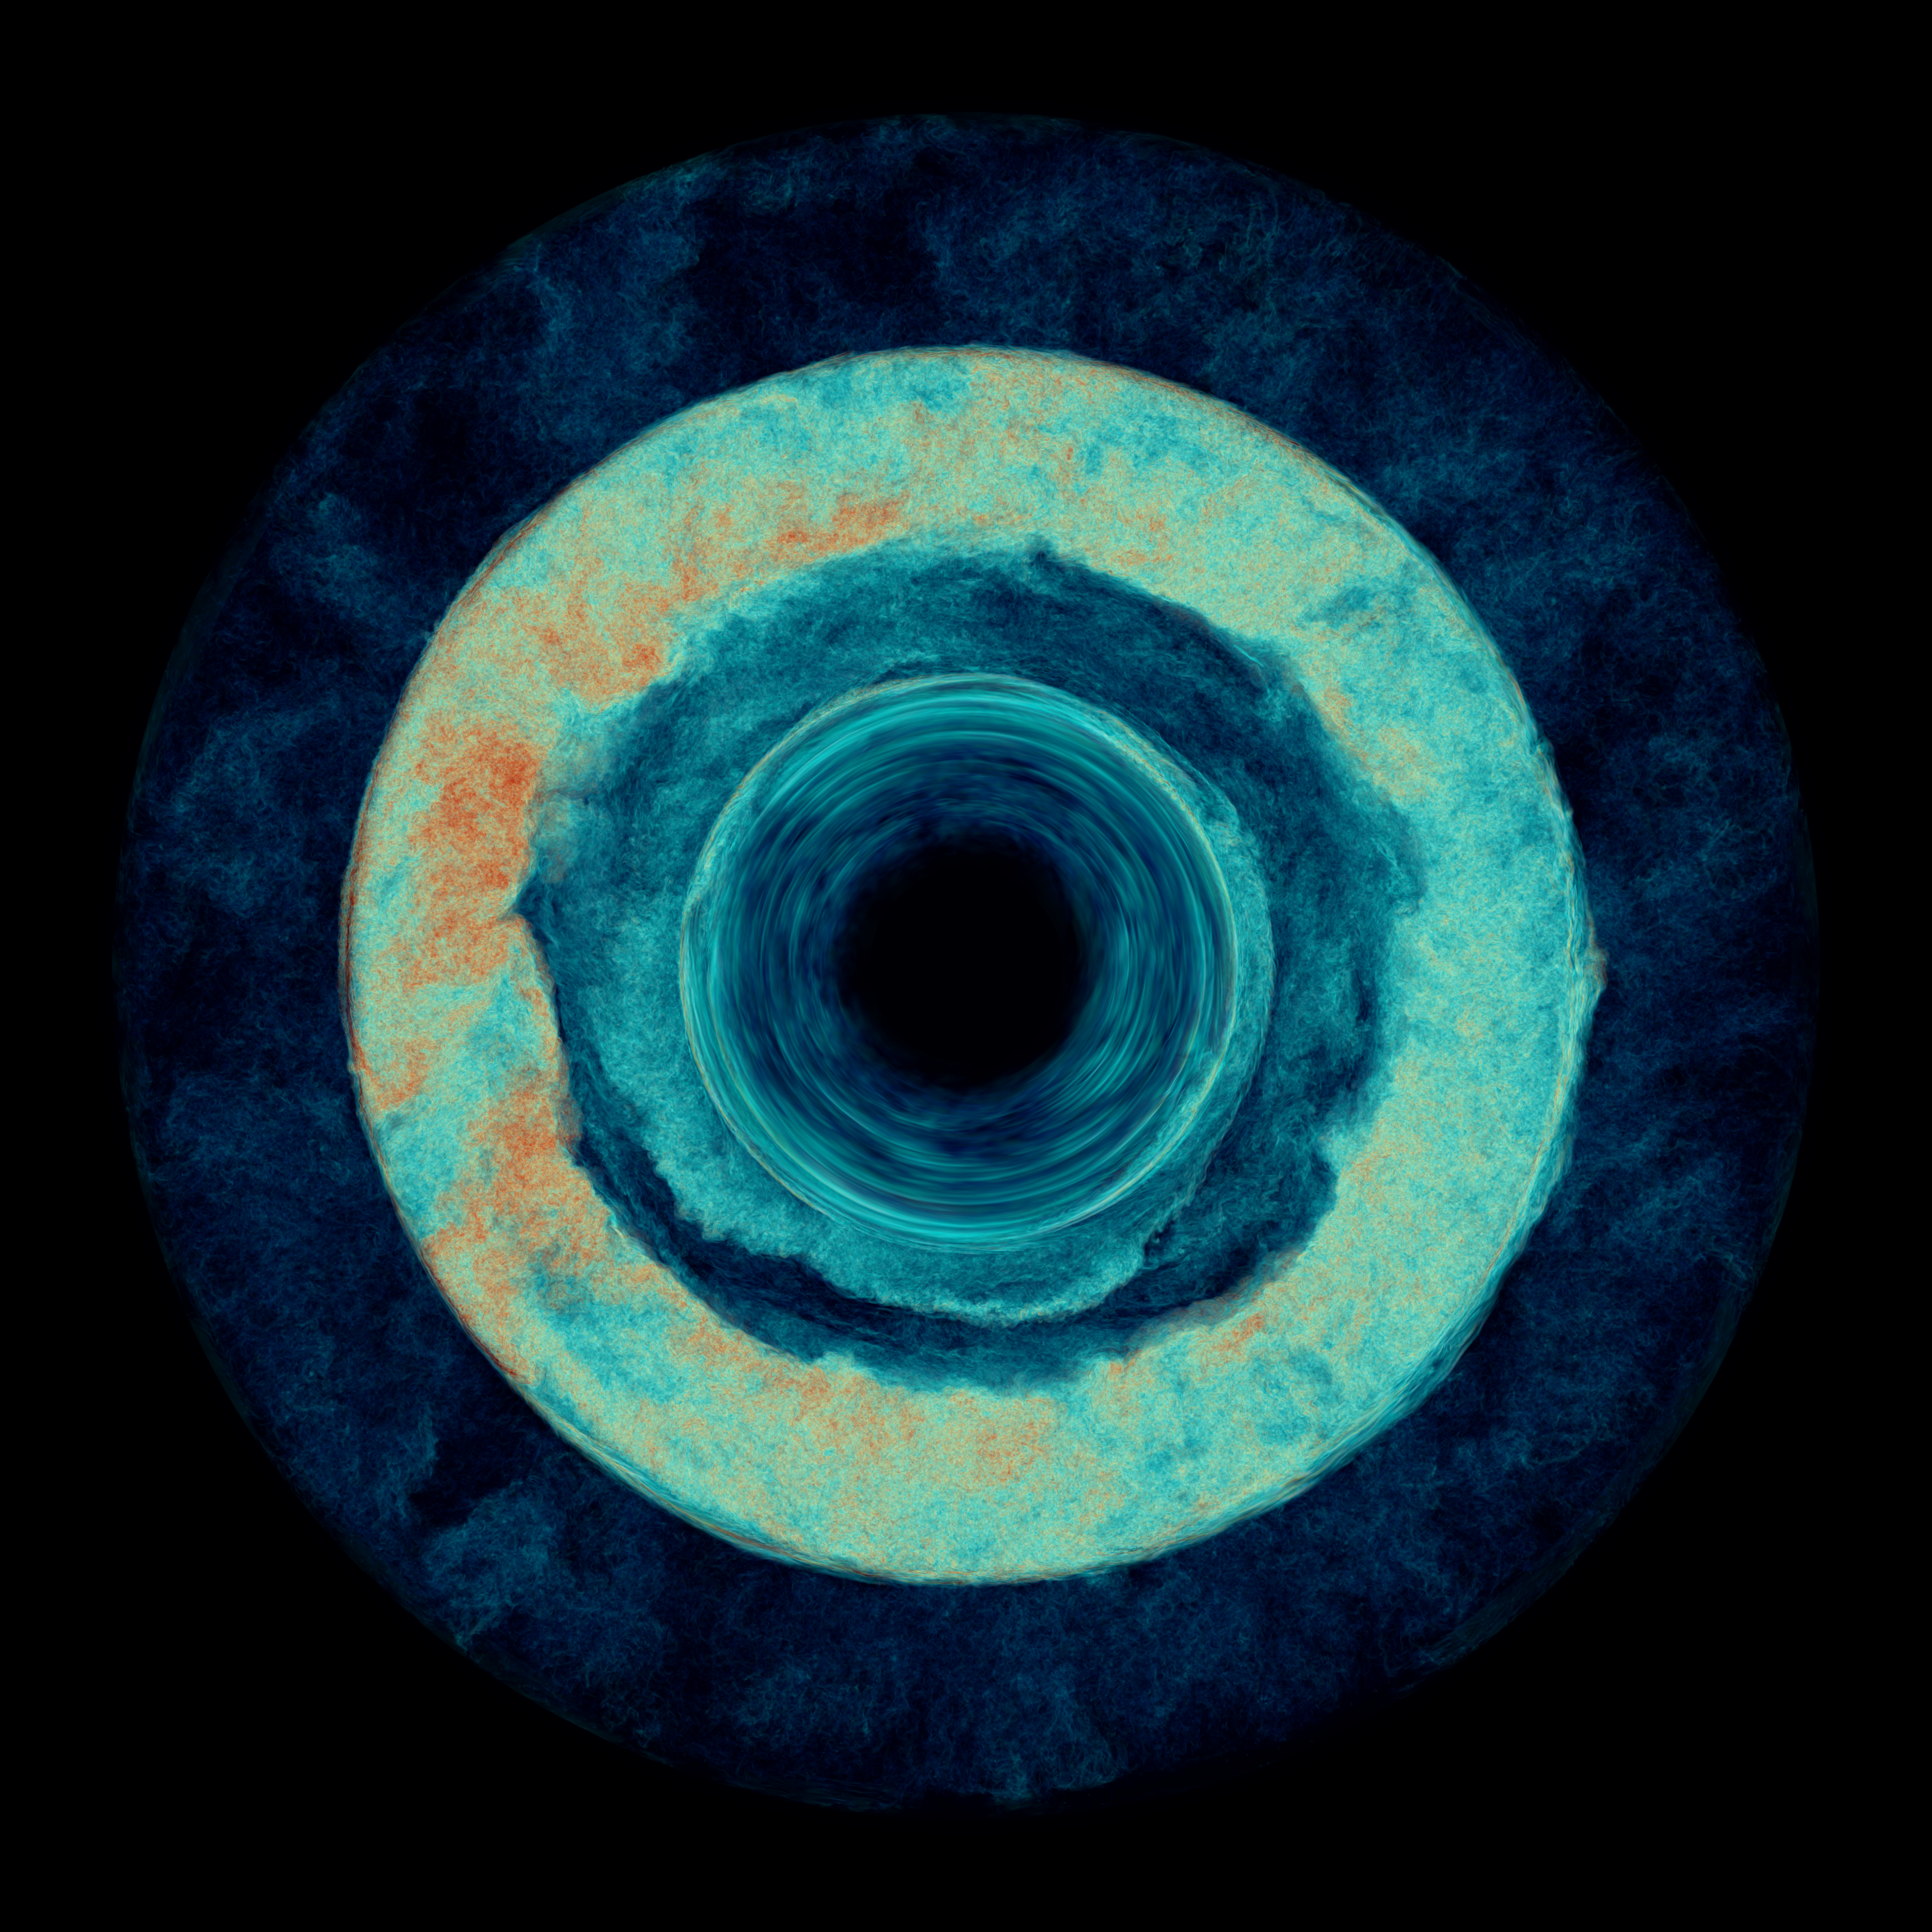
Movie of vorticity magnitude in a thin slice (2% of the domain) through the center of the star.
Movie of vorticity magnitude in a thin slice (2% of the domain) through the center of the star.
Movie of vorticity magnitude in a thin slice (2% of the domain) through the center of the star.
Movie of the log of the mixing fraction of material from above the lower convection zone in the far hemisphere of the star.
Movie of the magnitude of the velocity component perpendicular to the radial direction in a thin slice (2%, or perhaps it was 5%, of the domain) through the center of the star.
Movie of the magnitude of the velocity component perpendicular to the radial direction in a thin slice (2%, or perhaps it was 5%, of the domain) through the center of the star.
Movie of the magnitude of vorticity viewed from outside the star and with the material above 0.606 times the full domain radius of 330 Mm made transparent. plumes of turbulent gas can be seen welling up from below, rather like lots of tiny bubbles rising through water. These upwellings spread out over the sphere when they encounter the stably stratified gas, which has been made transparent in this rendering.
Movie of the magnitude of vorticity viewed from outside the star and with the material above 0.606 times the full domain radius of 330 Mm made transparent. plumes of turbulent gas can be seen welling up from below, rather like lots of tiny bubbles rising through water. These upwellings spread out over the sphere when they encounter the stably stratified gas, which has been made transparent in this rendering.
|
 The Laboratory for Computational Science & Engineering (LCSE)
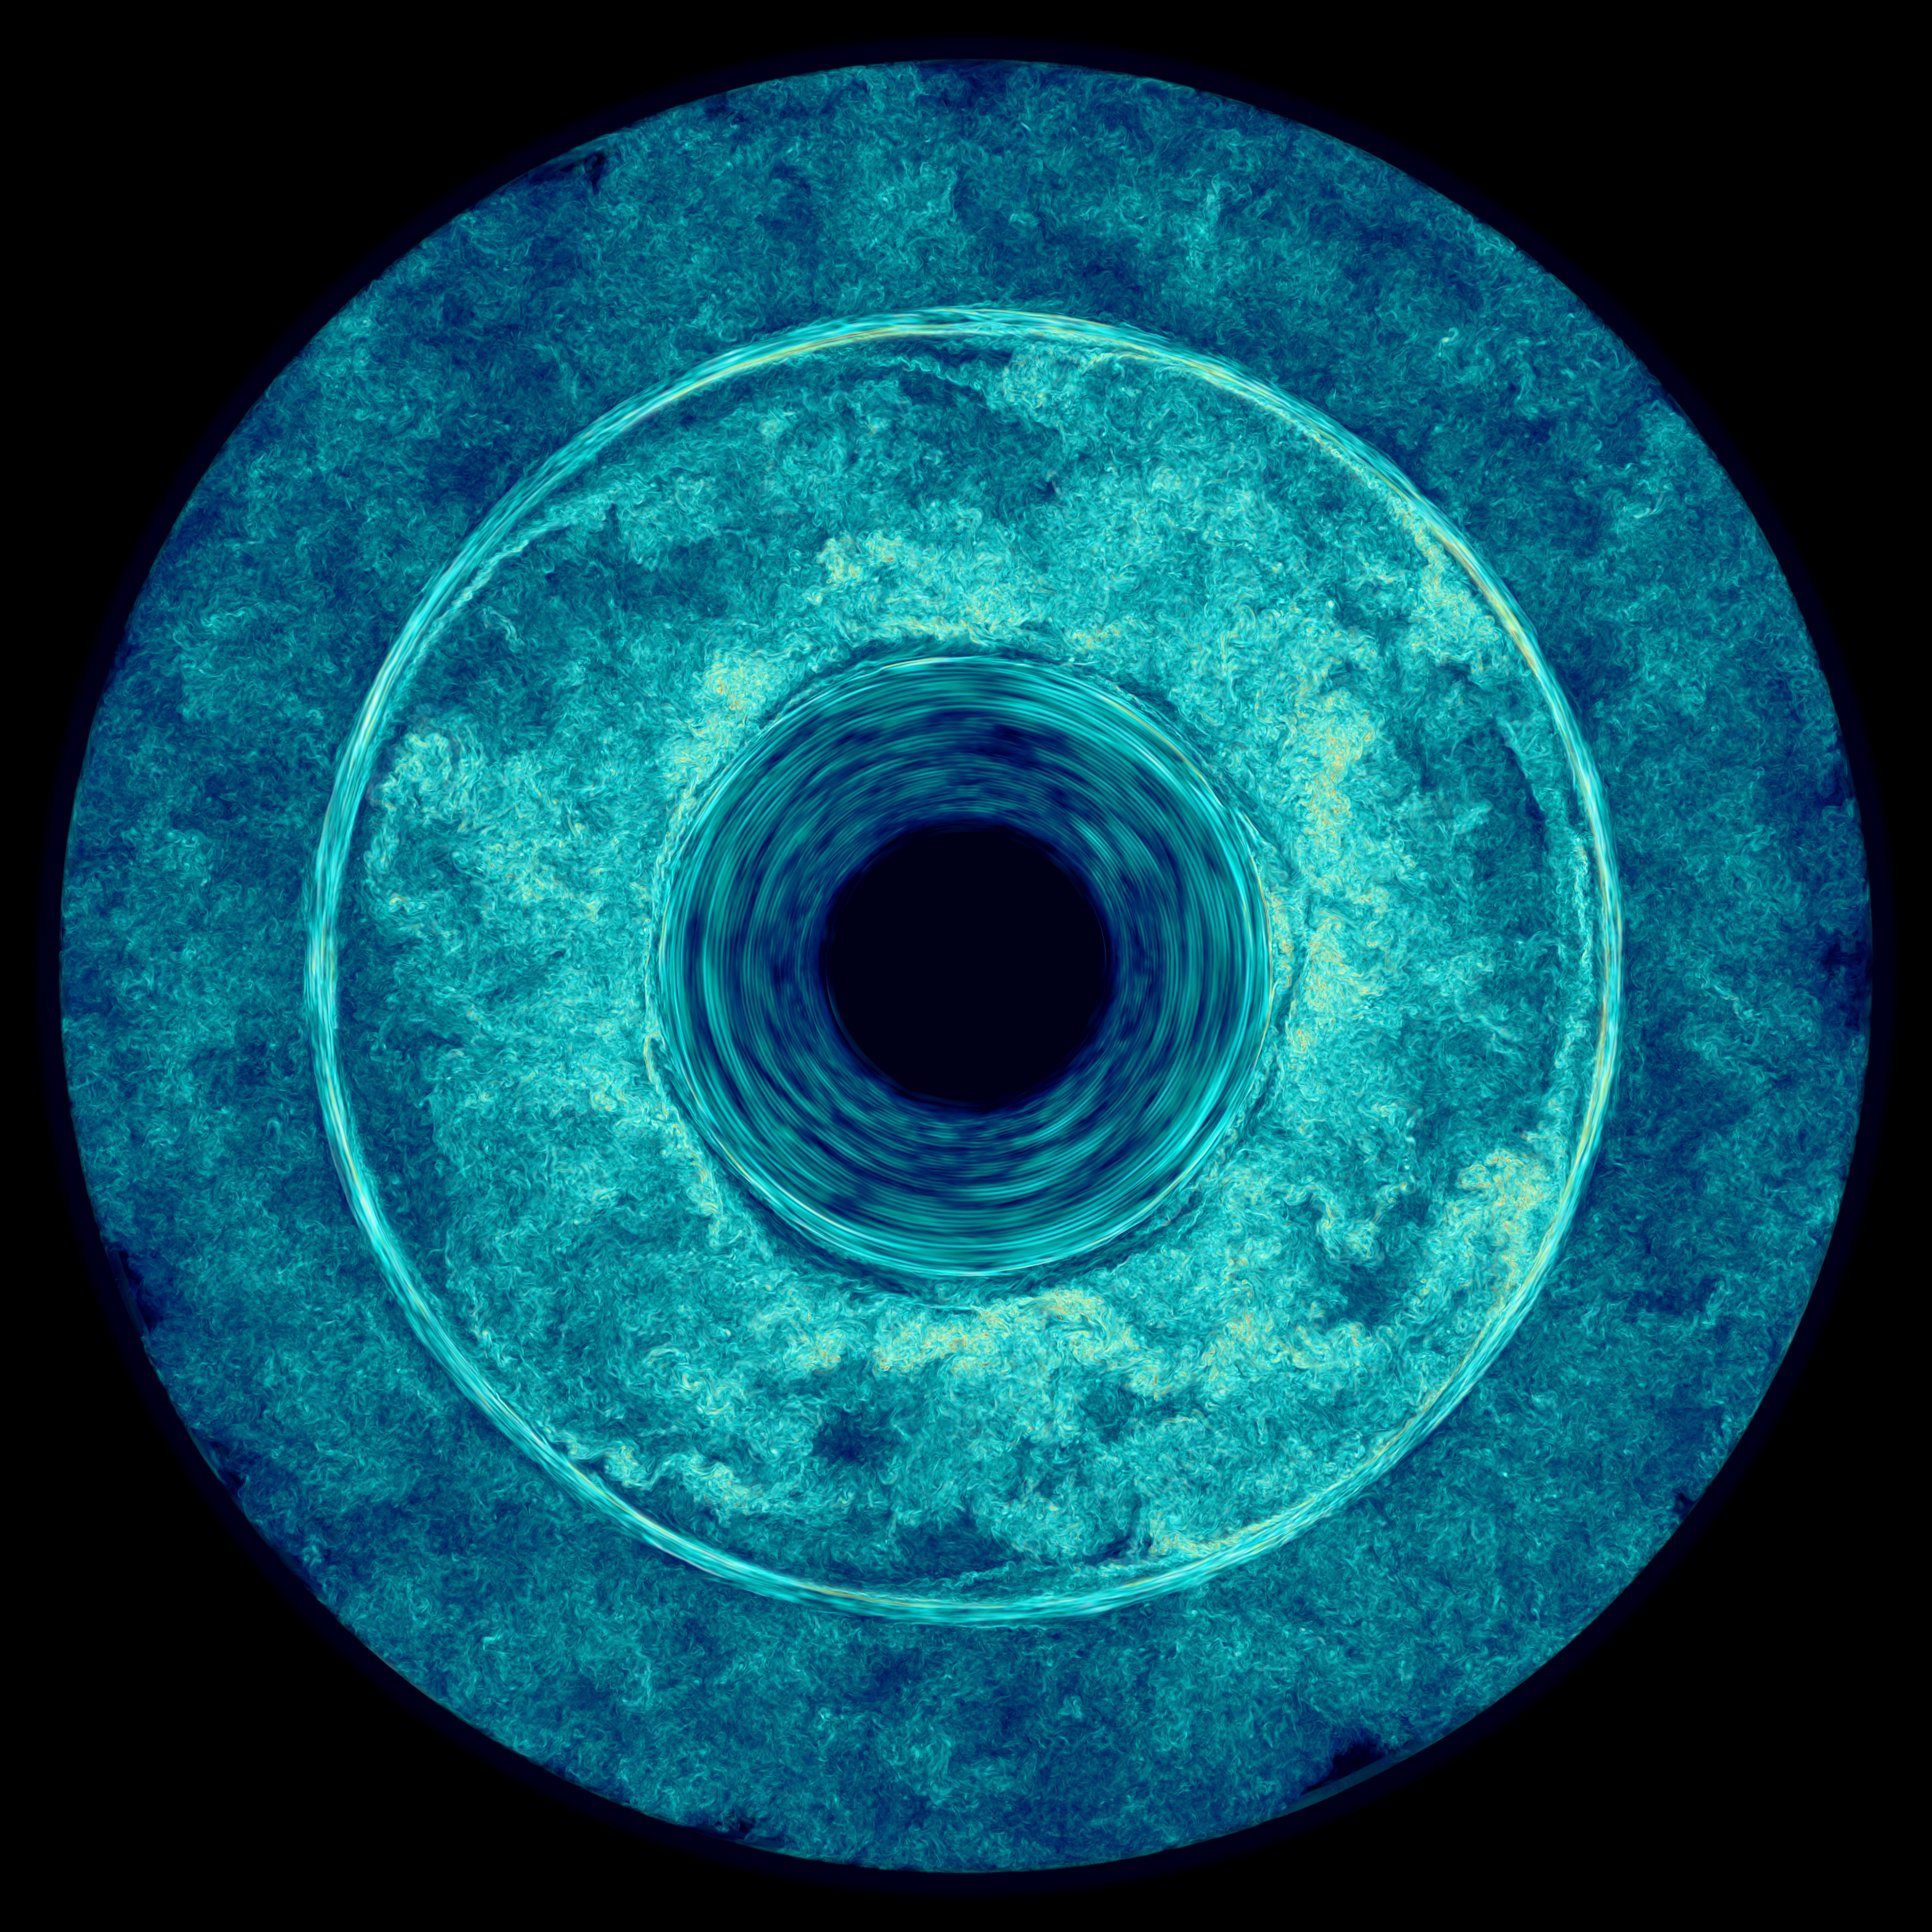


News from 2016:
PASC16 Plenary Talk
Prof. Paul Woodward presents Simulations of Hydrogen Ingestion Flashes in Giant Stars (Link)
Video of Paul Woodward on Simulations of Hydrogen Ingestion Flashes in Giant Stars (Link)
In this video from the PASC16 conference, Paul Woodward from the University of Minnesota presents: Simulations of Hydrogen Ingestion Flashes in Giant Stars.
“My team at the University of Minnesota has been collaborating with the team of Falk Herwig at the University of Victoria to simulate brief events in the lives of stars that can greatly affect the heavy elements they synthesize in their interiors and subsequently expel into the interstellar medium. These events are caused by the ingestion of highly combustible hydrogen-rich fuel into the convection zone above a helium burning shell in the deeper interior. Although these events are brief, it can take millions of time steps to simulate the dynamics in sufficient detail to capture subtle aspects of the hydrogen ingestion. To address the computational challenge, we exploit modern multicore and many-core processors and also scale the simulations to run efficiently on over 13,000 nodes of NSF’s Blue Waters machine at NCSA. Results of these simulations will be described along with some of the key numerical and computational techniques that make these simulations practical.”
Slides (PDF)
Paul Woodward: Simulating Hydrogen Ingestion Flashes in Stars in 3D
Falk Herwig: i process and The NuGrid/JINA pipeline: from nuclear to stellar physics and on to cosmological chemical evolution
Featured Simulations
Stereoscopic Movies
Left Eye

LowZAGB-1536-FVenucBackFront-05L

LowZAGB-1536-FVenucVort-back05L

LowZAGB-1536-VortBackFront-05L
Right Eye

LowZAGB-1536-FVenucBackFront-05R

LowZAGB-1536-FVenucVort-back05R

LowZAGB-1536-VortBackFront-05R
