
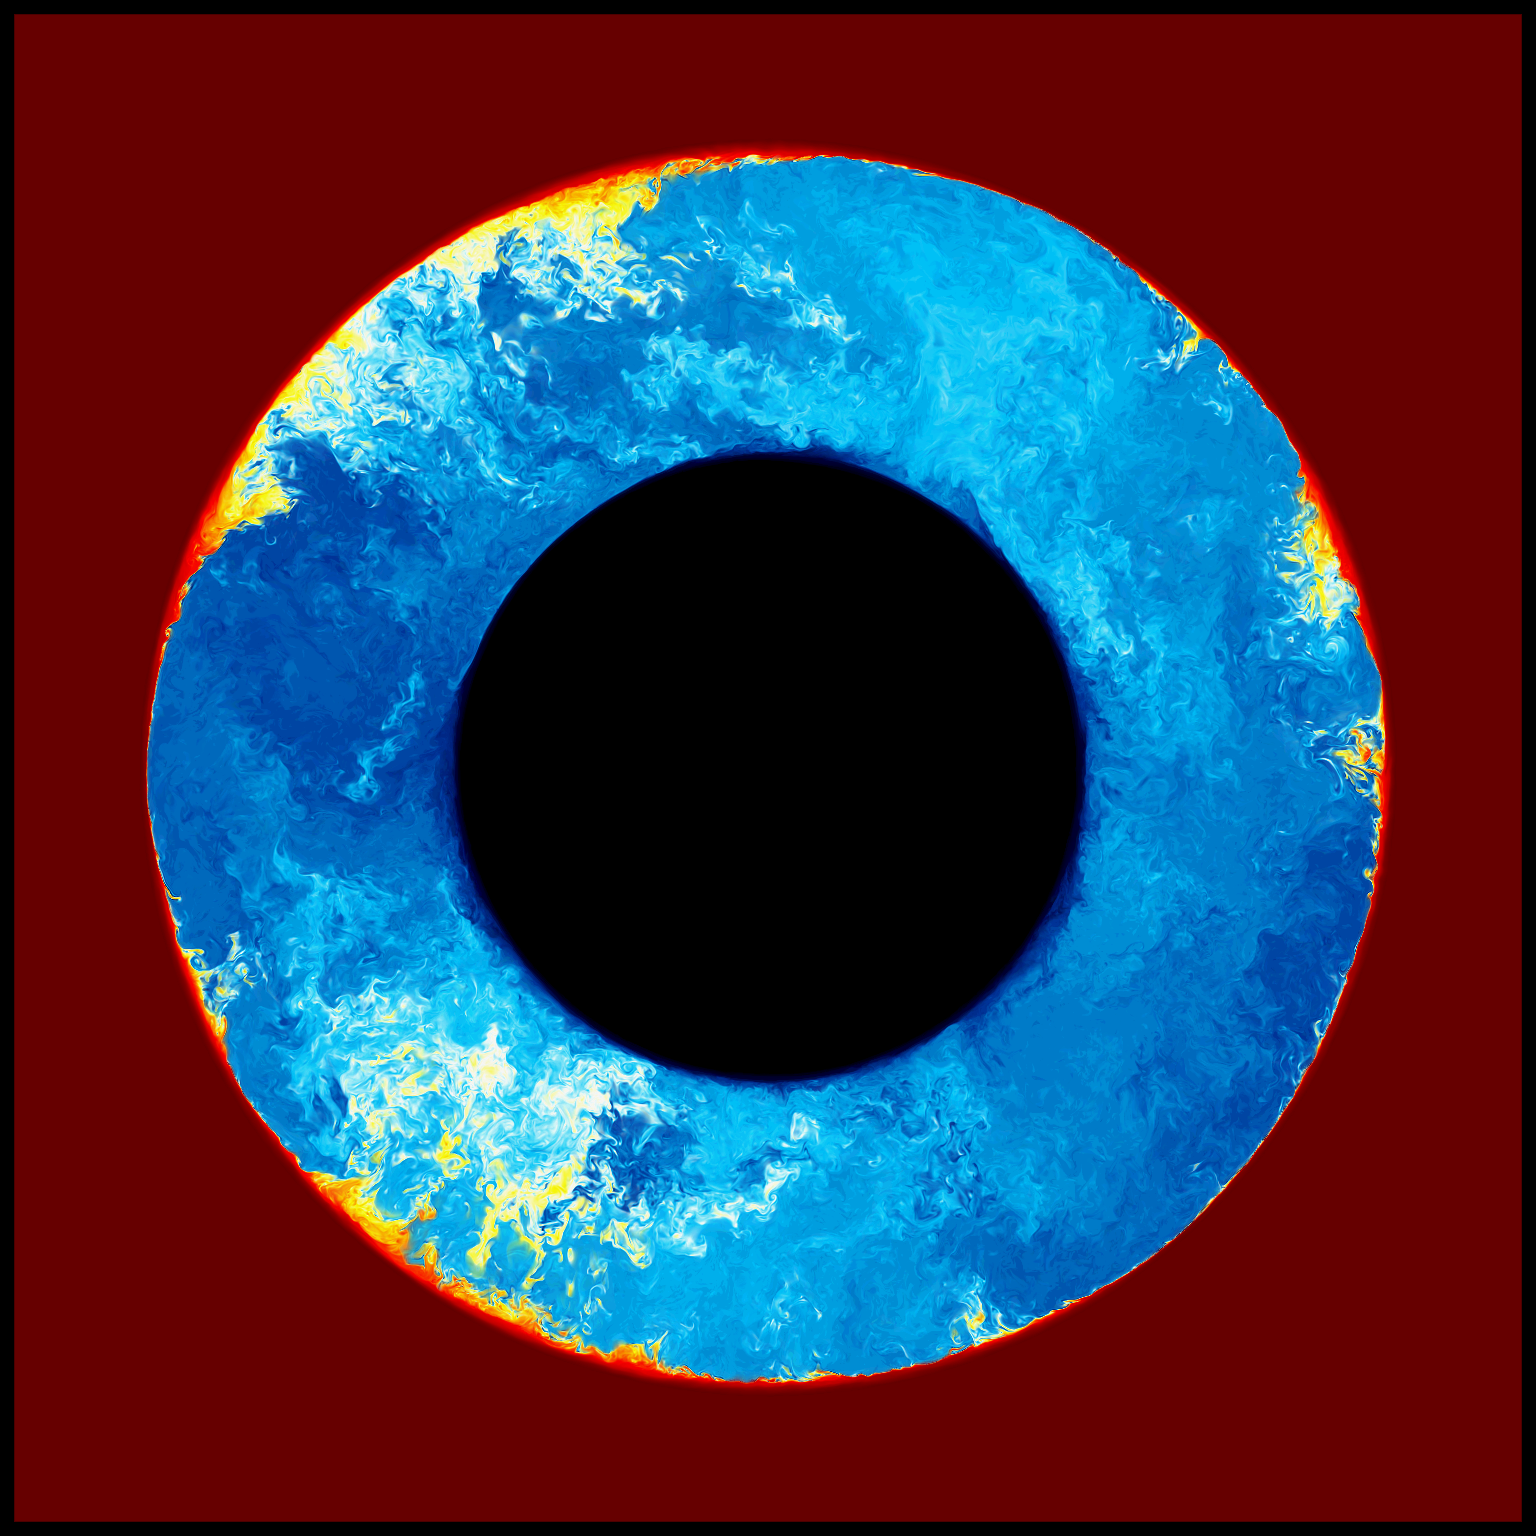
PS2
The PS2 simulation is another Rayleigh-Taylor run, similair to MS1 below (see description). Though both simulations are at the same resolution grid, the initial wave perturbation of PS2 has a lower frequency. Effectively, this means that each plume of gas will be "bigger," and in terms of visualization, easier to percieve.
MS1 Full Volume
The MS1 simulation is a Rayleigh-Taylor run, the denser fluid on top being accelerated into the less dense fluid beneath it. These two movies depict the fractional volume, where the red-yellow spectrum is the denser gas, and black-blue spectrum is the less dense gas. This simulation was preformed at the Pittsburgh Computing Center using 1024 compute nodes in approximately 20 hours. The dimensions of the run are 768^2 x 1536, but the fractional volume depicted here is put out at twice that resolution.
sg5 Vort
The sg5 run is a simulation of a Kelvin-Helmholtz instability. This instability is produced when two fluids flow past each other, and begins at the slip surface interface between the two fluids. The dimensions of this run are 1024x1024x2048 cells. The two fluids are of different densities.
xs4 div tau
This movie is another view of the XS4 run. The vorticity of this run can be viewed below. In this movie, the top right panel is the divergence of velcoity at full resolution. The other three panels are are the energies in each direction, after being put through box moment filters. Their effective resolution is 128x128x512. The top left panel is the energy in the Z direction, while the bottom left is y energy, and the bottom right is x energy.
Thunderstorm
The following movie shows cloud water from a few angles and then the relative vorticity. The resolution of this run is 1000x1000x500 and was done at NCSA.
Broccoli
A simulation of carbon hexafluoride being pushed up through a wire mesh. The movie starts with the last timestep from the simulation and will play through all the timesteps from a variety of angles.
Convectively Unstable Stratified Layer
A perspective volume rendering of the vorticity structures in a convectively unstable stratified layer is shown here. This simulation has been carried out using the PPM gas dynamics code on a grid of 512x512x256 cells. The problem was run on a 256-node Cray T3D partition at the Pittsburgh Super-computer Center. This calculation began with a convection flow computed on a coarser grid until a statistically steady flow was achieved. The fine grid of the simulation shown here allows both the large-scale convective motions and the small-scale turbulent motions as well as the interactions between the two to be treated in a single calculation.
Click here to see the article "Simulation of Convection in a Stratified Atmosphere"
Penetrative Convection
This movie shows one of our local area convection simulations. The simulation was done at the Pittsburgh Supercomputing Center, on their 512-node Cray T3D. It took over a year to complete this calculation, consuming 285,000 processor-hours in increments of various sizes. About 400 compressed data dumps, of 1.2 GB each, were created. We used a uniform grid of 512**3 cells with periodic boundary conditions in the horizontal directions and with flat, friction free walls at top and bottom. The top wall was held at a constant temperature, and a constant heat flux was introduced through the bottom. Only the top half of this volume was convectively unstable; the bottom half was stable, with the thermal diffusivity smothly varying, as in a real star, to create this transition. The movie shows temperature variations relative the the time averages of temperature for this run at each depth. From hot to cold, the colors run from yellow to red to transparent (neutral temperature) to blue to aqua. Near the bottom of the convection zone, large cold fluctuations are rare, so that this region is largely transparent. This allows one to look into the turbulent convection flow (which we find, by the way, to have a nice Kolmogorov spectrum in the appropriate range of length scales). In the lower half of the volume, this volume rendering shows temperature fluctuations caused by gravity waves driven by the pummeling of the cool, descending plumes (which actually become relatively hot for their depth as they decelerate in the stable region). This movie takes you on a tour, showing the time evolution of the relative temperature over and over (the transitions are noticeable once you understand that this is what is happening. The view from the top shows the many small convection cells there very nicely. Just as mixing length theory would imply, characteristic sizes of convection cells grow larger with depth, so by the time we go half-way down to the bottom of the convection zone, the periodic box is already rather limiting. Other studies show that the typical convection cell near the bottom of the convection zone would like to have at least twice the horizontal extent allowed in this simulation. We knew this, but insisted upon resolving the first several turbulent scales and thus could not afford the billion-cell grid that would have been necessary to give this flow enogh room at all depths to do just what it liked. Rather than do a bigger run of this type we switched to encompassing the entire stellar model with our grid.
Big Star
This is a movie made from a run at NCSA, a run using the Origin-2000. In this run we are evolving an entire rotating model star on a uniform Cartesian grid. The section of the grid containing the star was about 512**3 cells, although the total grid was larger. This run took about 14 days (including the run on a 256**3 mesh which was used to provide an initial condition). About 1200 compressed dumps were used to make this movie. In all, we saved about 2 TB of data from this run on Ampex tapes. The calculation was performed in a frame rotating at the original uniform rotation rate of this star. Nevertheless, this movie starts out with the observer in an inertial frame, and then later goes into the rotating frame, where the developing differential rotation, caused by the convection, is more easily seen. The colors in this movie show the size of the vertical (radial) component of velocity. This velocity component is of course highly corellated to the temperature fluctuations. Relatively cool gas tends to be moving inward and relatively hot gas tends to be moving outward (upward). Perhaps the most interesting section of this movie is when we cut away the top half of the star (like one slices a cantaloupe). Then you can see the tendency for the convection cells to line up along longitudinal lines, so that transient "banana cells" are formed which soon are torn apart by the differential rotation, but later reform, collecting segments of previous different banana cells into new banana cell structures. Just looking at the blue and red structures (you look from the center of the star outward at the lower regions of the convection zone), you can clearly see the differential rotation that has developed.
Red Giant Star
This movie is of relative temperature fluctuations, with different amounts of transparency at different stages of the movie, showing either the surface features or the interior global dipole flow pattern. We have analyzed the 1 TB of data from this run in some detail, with data stretching over 2 or 3 orders of magnitude in pressure we see statistical behavior that fits a mixing length parametrization that we used in our local region convection studies. We also see a nice region of the velocity power spectrum, corresponding to small length scales (but not so small that dissipation effects play a role), over which a Kolmogorov turbulent power spectrum is observed.
K Cube Vorticity
This movie is of the K cube data set. It shows vorticity.
Click here to see the article "NUMERICAL SIMULATION OF COMPRESSIBLE TURBULENCE"
Three Solar Mass Red Giant Star
Here we are modeling a three solar mass red giant star. This movie is of relative temperature, where warm and hot gas is red and yellow while cool and cold gas is blue and aqua. The star is visualized as being sliced through the center. This perspective was chosen because it shows the stong dipolar flow around the core as well as the overall large convective motion of the pulsating star. It is important to note that the pulsations are not imposed, but follow naturally from the convective motions.
xs4
The xs4 run is the simulation of a shockwave created by two slabs of turbulent gas colliding. Initially, four replicas of a 512^3 size, blended-down turbulent brick are placed in a row. This makes the simulation's resolution 512 by 512 by 2048. As the simulation starts, the left two bricks and right two bricks are thrown into each other at a velocity of mach 4. The shockwave created by this collision travels outward at a velocity of around mach 1.07. The special boundaries on the right and left ends constantly send in new turbulence bricks to collide with the shockwave. This run demonstrates the rapid isotopization of turbulence after it experiences a shock. This simulation was done on our own Unisys ES7000, using 14 processors, and took approximately 1.5 months to complete.