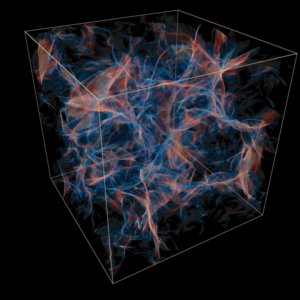
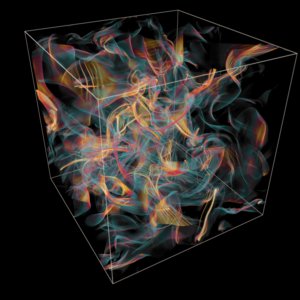
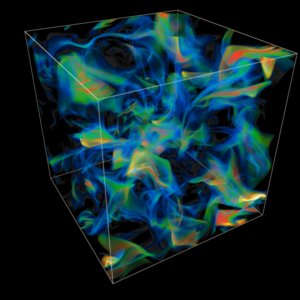
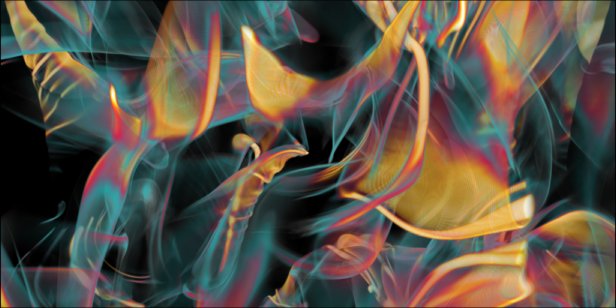
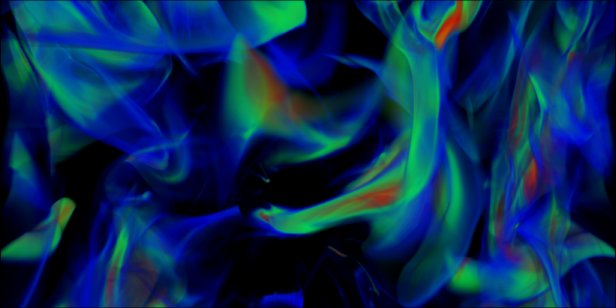
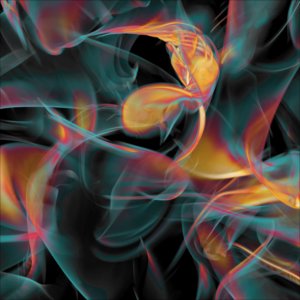
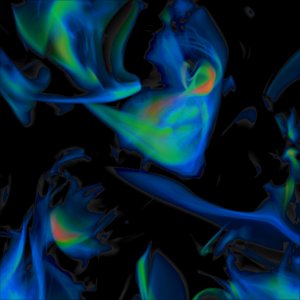
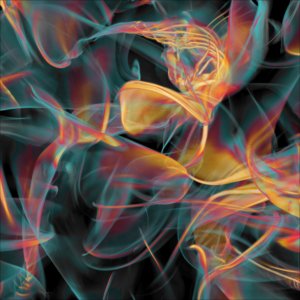
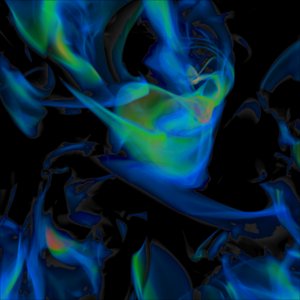
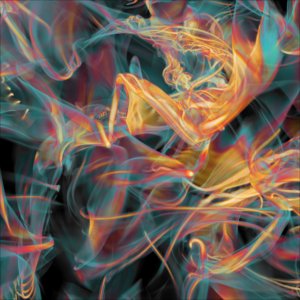
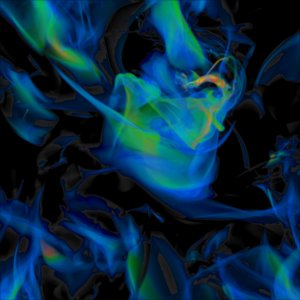
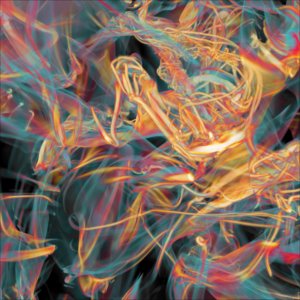
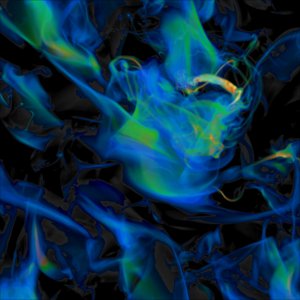
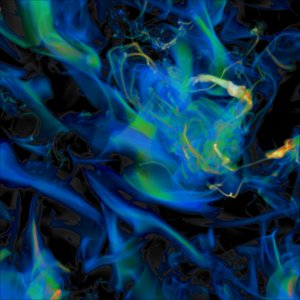
Images of a Billion-Zone Compressible Turbulence Calculation from Los Alamos National Lab
The following are the quantities referred on this page:
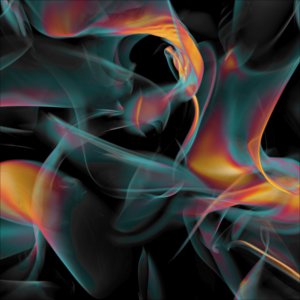
vorticity = |curl(vx,vy,vz)| Color bar
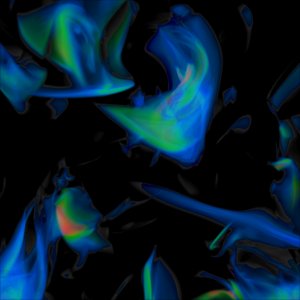
entropy = ln(p/d^gamma) Color bar
compression = -div curl(vx,vy,vz) Color bar 
Compression
1024x1024 tif
4096x4096 tif
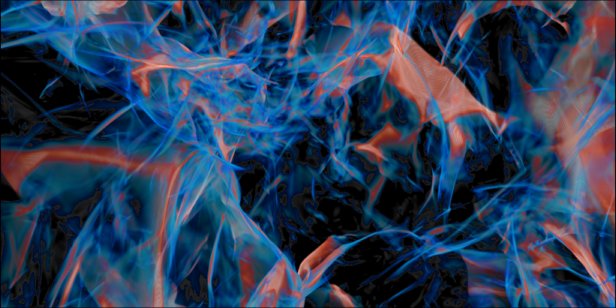
Vorticity
1024x1024 tif ----
4096x4096 tif
Entropy
1024x1024 tif ----
4096x4096 tif
Now (the identical) closeup view.
Compression
2048x1024 tif
4096x2048 tif
Vorticity
2048x1024 tif ----
4096x2048 tif
Entropy
2048x1024 tif ----
4096x2048 tif
The following are steps in time of a full view of the center of the dataset.
The area renderend is a full (1024x1024) slice through the volume, centered
at the middle. The xy slice rendered is viewed from -z, and is about 25%
of the volume.
| Time |
vorticity |
entropy |
| t=0.75 |
1200x1200 tif,
2400x2400 tif
|
1200x1200 tif,
2400x2400 tif
|
| t=0.80 |
1200x1200 tif,
2400x2400 tif
|
1200x1200 tif,
2400x2400 tif
|
| t=0.85 |
1200x1200 tif,
2400x2400 tif
|
1200x1200 tif,
2400x2400 tif
|
| t=0.90 |
1200x1200 tif,
2400x2400 tif
|
1200x1200 tif,
2400x2400 tif
|
| t=0.95 |
1200x1200 tif,
2400x2400 tif
|
1200x1200 tif,
2400x2400 tif
|
| t=1.00 |

1200x1200 tif,
2400x2400 tif
|
1200x1200 tif,
2400x2400 tif
|
Rendering by David Porter and Sarah Anderson.