The Laboratory for Computational Science & Engineering (LCSE)
 The Laboratory for Computational Science & Engineering
(LCSE)
The Laboratory for Computational Science & Engineering
(LCSE)
provides a facility within the University of Minnesota’s Digital Technology
Center in which innovative hardware and system software solutions to problems
in computational science and engineering can be tested and applied. The LCSE has a broad mandate to develop
innovative high performance computing and data visualization technologies in
collaboration with both government and industry. The lab is open to the University’s Institute of Technology
faculty and their students.
 High Performance Computing
research in the LCSE has been focused since the lab’s founding in 1995
on the SMP cluster architecture, with which LCSE researchers did pioneering
work with Silicon Graphics in 1993.
SMP clusters containing thousands of nodes today have only 2 to
4 processors in each SMP.
However, thanks to a generous donation from Unisys, the LCSE is now working
with a Unisys ES7000 machine, which houses two SMPs, each with 16 Intel
Itanium-2 CPUs running at 1 GHz and each with 32 GB of memory.
Such powerful new SMPs offer the potential to build more attractive SMP clusters
based on the Intel IA-64 CPU architecture in the near future.
The LCSE is an NCSA
Alliance partner, and is developing methods to exploit geographically
distributed SMP clusters such as the NSF TeraGrid. Through support from the DoE ASCI program, the LCSE is also
targeting very large, tightly coupled SMP clusters. In addition to the classic
emphasis on single node performance and parallel algorithm structure, these new
cluster systems demand more flexible computing techniques that are latency
tolerant, fault tolerant, and that adapt dynamically to changing system
loads.
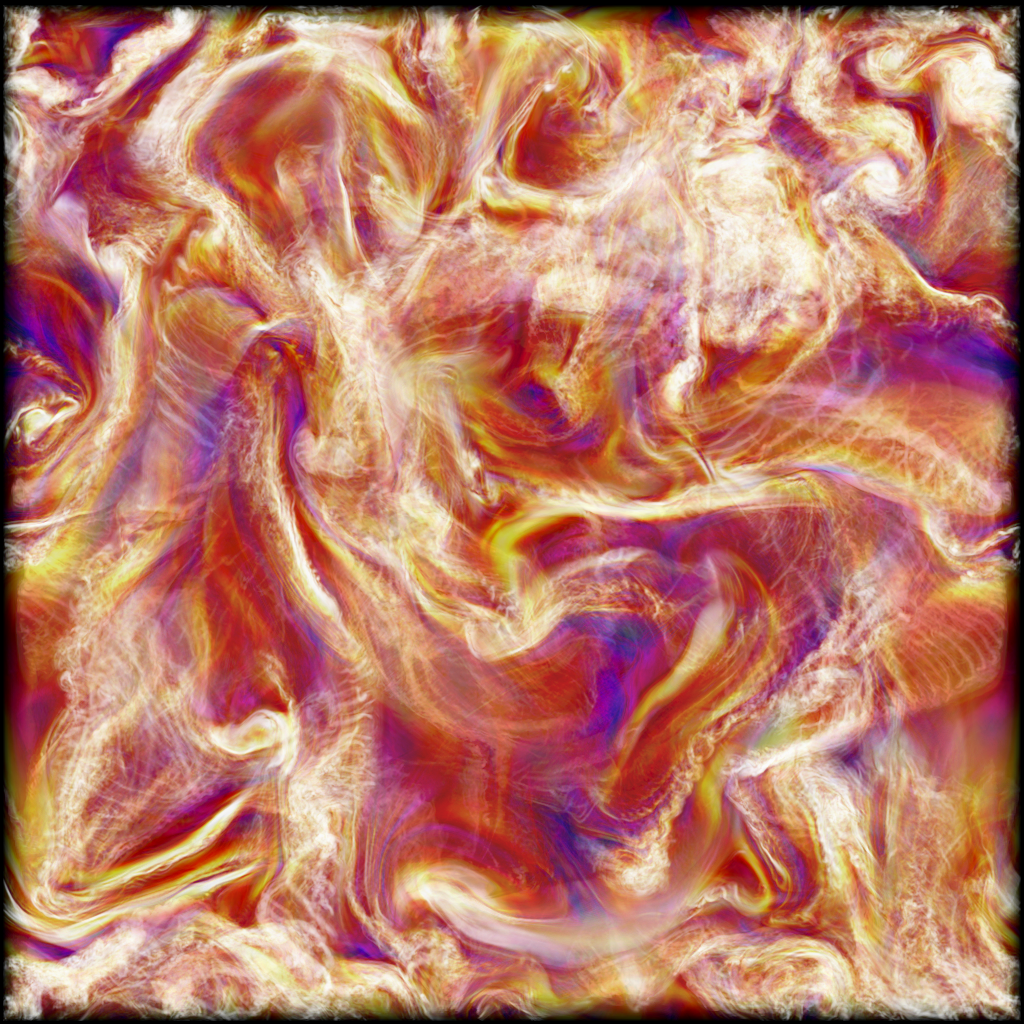
The LCSE’s SHMOD (SHared Memory
On Disk) and PPMlib libraries have been
used to compute the billion-cell simulation of homogeneous, compressible
turbulence, from which the vorticity distribution in a slice of the domain is
visualized here at the left (using the LCSE's HVR volume rendering utility).
All this LCSE software is available for download from this Web site.
See www.lcse.umn.edu/shmod
for the SHMOD library, example code, and documentation.
See www.lcse.umn.edu/PPMlib
for the PPMlib library and documentation.
See www.lcse.umn.edu/hvr
for the HVR volume rendering utility and documentation.
High Performance Computing
research in the LCSE has been focused since the lab’s founding in 1995
on the SMP cluster architecture, with which LCSE researchers did pioneering
work with Silicon Graphics in 1993.
SMP clusters containing thousands of nodes today have only 2 to
4 processors in each SMP.
However, thanks to a generous donation from Unisys, the LCSE is now working
with a Unisys ES7000 machine, which houses two SMPs, each with 16 Intel
Itanium-2 CPUs running at 1 GHz and each with 32 GB of memory.
Such powerful new SMPs offer the potential to build more attractive SMP clusters
based on the Intel IA-64 CPU architecture in the near future.
The LCSE is an NCSA
Alliance partner, and is developing methods to exploit geographically
distributed SMP clusters such as the NSF TeraGrid. Through support from the DoE ASCI program, the LCSE is also
targeting very large, tightly coupled SMP clusters. In addition to the classic
emphasis on single node performance and parallel algorithm structure, these new
cluster systems demand more flexible computing techniques that are latency
tolerant, fault tolerant, and that adapt dynamically to changing system
loads.
The LCSE’s SHMOD (SHared Memory
On Disk) and PPMlib libraries have been
used to compute the billion-cell simulation of homogeneous, compressible
turbulence, from which the vorticity distribution in a slice of the domain is
visualized here at the left (using the LCSE's HVR volume rendering utility).
All this LCSE software is available for download from this Web site.
See www.lcse.umn.edu/shmod
for the SHMOD library, example code, and documentation.
See www.lcse.umn.edu/PPMlib
for the PPMlib library and documentation.
See www.lcse.umn.edu/hvr
for the HVR volume rendering utility and documentation.
 Scientific Visualization
has driven much of the work on systems and software at the LCSE. The need to extract scientific understanding
from the terabytes of numerical data produced by supercomputer simulations has
driven LCSE researchers to develop powerful visualization systems and
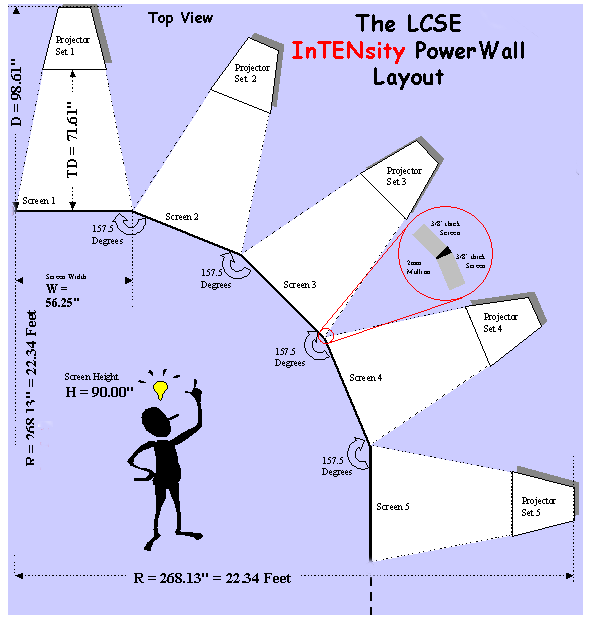
software. The LCSE worked with Silicon
Graphics, Seagate, and Ciprico to develop the PowerWall visualization system in
1994. The LCSE’s latest refinement of
the PowerWall, now installed in the first floor of the Digital Technology
Center, has been supported by NSF and the DoE through NCSA and the ASCI
program, as well as generous support from SGI, Cray, Seagate, Ciprico, Ancor,
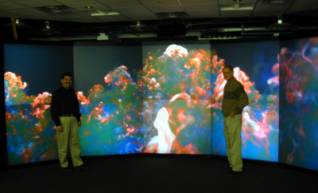
and Brocade. The 13 million pixels of
the PowerWall display allow researchers to see simulation or other data in
unprecedented detail. The PowerWall can
also be used to present multiple related views simultaneously. An example is given by the 6 visualizations
below on this page showing different physical variables from the same
simulation of a giant star in the late stages of its life.
The LCSE is presently working with Unisys to experiment with driving the entire
PowerWall from a single Unisys ES7000 machine.
Scientific Visualization
has driven much of the work on systems and software at the LCSE. The need to extract scientific understanding
from the terabytes of numerical data produced by supercomputer simulations has
driven LCSE researchers to develop powerful visualization systems and
software. The LCSE worked with Silicon
Graphics, Seagate, and Ciprico to develop the PowerWall visualization system in
1994. The LCSE’s latest refinement of
the PowerWall, now installed in the first floor of the Digital Technology
Center, has been supported by NSF and the DoE through NCSA and the ASCI
program, as well as generous support from SGI, Cray, Seagate, Ciprico, Ancor,
and Brocade. The 13 million pixels of
the PowerWall display allow researchers to see simulation or other data in
unprecedented detail. The PowerWall can
also be used to present multiple related views simultaneously. An example is given by the 6 visualizations
below on this page showing different physical variables from the same
simulation of a giant star in the late stages of its life.
The LCSE is presently working with Unisys to experiment with driving the entire
PowerWall from a single Unisys ES7000 machine.
 PC Clusters and Storage Area Networks
have provided the principal engines for data
analysis, image rendering, and movie animation at the LCSE until the
recent arrival of the Unisys ES7000. A heterogeneous cluster of 10 PCs now
handles movie animation on the PowerWall display. This system exploits the powerful new
graphics cards develped for PC gamers to render images in parallel
for the PowerWall from multi-terabyte data sets.
We are in the process of rebuilding the LCSE infrastructure, so that the new
Unisys ES7000 machine, attached to a Fibre Channel storage area network (SAN) of 4.8 TB
capacity, can act as the central nervous center of the system.
With a Gigabit Ethernet link
to the University’s OC-12 Internet-2 connection, massive data sets can be
streamed onto the LCSE SAN for data analysis and visualization. The LCSE is developing software (see
www.lcse.umn.edu/hvr) to allow remote
users to steer the visualization of such data and to stream the resulting movie
animations to their local displays.
PC Clusters and Storage Area Networks
have provided the principal engines for data
analysis, image rendering, and movie animation at the LCSE until the
recent arrival of the Unisys ES7000. A heterogeneous cluster of 10 PCs now
handles movie animation on the PowerWall display. This system exploits the powerful new
graphics cards develped for PC gamers to render images in parallel
for the PowerWall from multi-terabyte data sets.
We are in the process of rebuilding the LCSE infrastructure, so that the new
Unisys ES7000 machine, attached to a Fibre Channel storage area network (SAN) of 4.8 TB
capacity, can act as the central nervous center of the system.
With a Gigabit Ethernet link
to the University’s OC-12 Internet-2 connection, massive data sets can be
streamed onto the LCSE SAN for data analysis and visualization. The LCSE is developing software (see
www.lcse.umn.edu/hvr) to allow remote
users to steer the visualization of such data and to stream the resulting movie
animations to their local displays.
 An experiment in Grid computing
is now underway at the LCSE.
With support from an NSF CISE Research Resources grant, and from the Digital Technology Center
(DTC) through the Minnesota Supercomputing Institute (MSI), the LCSE is connecting its
recently donated Unisys ES7000 to 66 Dell PCs and 32 Macs in a student lab
operated by the University of Minnesota's Academic and Distributed Computing
Services.
This student lab is located on the same floor of the DTC building as the LCSE.
We are adding to the Dell PCs dual 200 GB 7200 RPM Maxtor ATA-133 drives, with
file systems striped by the Microsoft Windows 2000 operating system.
We are also adding new Nvidia-based graphics cards and Gigabit Ethernet NICS
to interconnect these machines on an extensive switching fabric.
A TCP/IP version of our SHMOD framework's sRIO remote I/O server utility is
being installed on each PC, making this a powerful storage area network.
When the students are not using these machines, we plan to run both our PPM
gas dynamics simulation code and our data analysis and visualization software
on this system, coordinated by the Unisys ES7000 in the LCSE via the SHMOD framework.
This is an experiment in Grid computing in which we are collaborating with
the University of Minnesota's Center for Computational Genomics and Bioinformatics
as well as the Fond du Lac Tribal and Commmunity College in Cloquet, Minnesota.
An experiment in Grid computing
is now underway at the LCSE.
With support from an NSF CISE Research Resources grant, and from the Digital Technology Center
(DTC) through the Minnesota Supercomputing Institute (MSI), the LCSE is connecting its
recently donated Unisys ES7000 to 66 Dell PCs and 32 Macs in a student lab
operated by the University of Minnesota's Academic and Distributed Computing
Services.
This student lab is located on the same floor of the DTC building as the LCSE.
We are adding to the Dell PCs dual 200 GB 7200 RPM Maxtor ATA-133 drives, with
file systems striped by the Microsoft Windows 2000 operating system.
We are also adding new Nvidia-based graphics cards and Gigabit Ethernet NICS
to interconnect these machines on an extensive switching fabric.
A TCP/IP version of our SHMOD framework's sRIO remote I/O server utility is
being installed on each PC, making this a powerful storage area network.
When the students are not using these machines, we plan to run both our PPM
gas dynamics simulation code and our data analysis and visualization software
on this system, coordinated by the Unisys ES7000 in the LCSE via the SHMOD framework.
This is an experiment in Grid computing in which we are collaborating with
the University of Minnesota's Center for Computational Genomics and Bioinformatics
as well as the Fond du Lac Tribal and Commmunity College in Cloquet, Minnesota.
Pushing the Limits of Disk System Capacity and Speed is a constant occupation for the LCSE. Its data visualization applications have provided a demanding testbed for the latest products of the visualization and storage industries. This led to early experimentation with storage area networks and shared file systems in collaboration with SGI, Seagate, Ciprico, Ancor, and Brocade. Two new companies, Sistina Software and DataPlow, came out of this work. The LCSE invites collaboration with industry to jointly explore new mechanisms to deal with the extremely large simulation data sets that will soon be coming into the lab. Each simulation on the 8-billion-cell grids now possible can generate as much as 100 TB, which will need to be condensed in the lab and converted to visual form in order to enable scientific discovery.
Contact Information: Laboratory for Computational Science & Engineering, 499 Walter Library, 117 Pleasant St. S.E., Minneapolis, MN 55455. 612-625-4097.
Prof. Paul R. Woodard, LCSE Director; Dept. of Astronomy; paul@lcse.umn.edu
Ms. Julia Sytine, LCSE Administrator; 612-625-4097; julia@lcse.umn.edu
Dr. David H. Porter, Scientist; dhp@lcse.umn.edu
Ms. Sarah E. Anderson, Computer Scientist; sea@lcse.umn.edu
Mr. Ben Allen, Systems Administrator; Benjamin@lcse.umn.edu
Simulations Featured in the PowerWall Demo:
 1.
Richtmyer-Meshkov Instability.
1.
Richtmyer-Meshkov Instability.
This simulation was
carried out in collaboration with the Lawrence Livermore National Lab and
IBM. The LCSE’s sPPM gas dynamics code
was run on a grid of 8 billion cells on 3840 processors of the IBM ASCI system
at LLNL. This calculation was awarded
the 1999 Gordon Bell Prize in the performance category. The movie shows a sequence of roughly 3000
images of the gas entropy, which reveals the degree of mixing between two gases
whose unstable multifluid interface has been forced through a wire mesh by a
Mack 1.5 shock.
2.
Turbulence.
This simulation (see image earlier on this page) with the LCSE’s PPM gas dynamics
code was carried out on a grid of 1
billion cells on NCSA’s new Itanium cluster.
A more refined, 8-billion-cell simulation is underway as a “charter
application” for the NSF TeraGrid.
Data from this new simulation will be accurate enough to use as a numerical experiment
that can serve to constrain and validate potential subgrid-scale models of turbulence.
 3.
Red Giant Star.
3.
Red Giant Star.
The LCSE team has studied
the process of convection in stars like the sun for many years, funded by both
NSF and NASA Grand Challenge grants.
More recently, studies have shifted to convection in the extended
envelopes of giant stars near the ends of their lives. At the right, 6 related variables are
visualized in a simplified model of a three solar mass giant star. In the image at the top left, a plume of
relatively cool gas is seen (in blue) plunging into the central stellar core,
being heated (yellow), and rising again on the other side.
The apparent elliptical shapes of these views comes from the perspective on
this star that has been sliced in half, so that we may see the global convection
pattern in the interior.
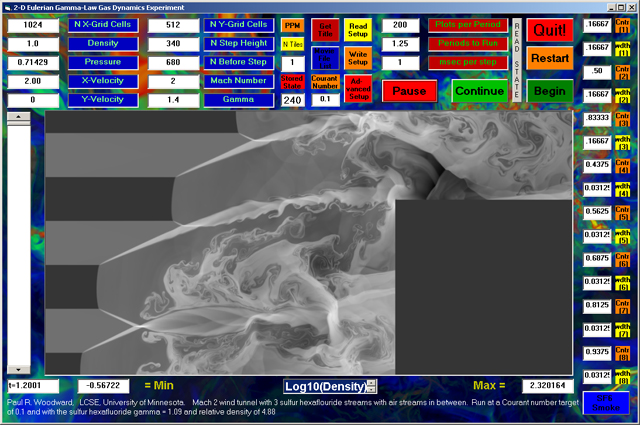 Play with a 2-D Version of the PPM Gas Dynamics Code
on your own Windows PC.
A 2-D version of the LCSE's PPM gas dynamics code can be downloaded from this
Web site that will run a standard fluid dynamics test problem on your own PC.
You might encounter a bug or two in the functioning of the window's controls,
but this program has been run by University of Minnesota freshman successfully.
If they can do it, you can too.
Compressible fluid dynamics fans will recognize this test problem as the one
first introduced by Emery in 1967.
This is an updated version, with lots more interest than the original, so our
freshmen would not get bored.
Read about an earlier version of this program (we think it is backwards
compatible and are too lazy to update the documentation) in the LCSE Wind
Tunnel Experimenter's User Guide at
www.lcse.umn.edu/PPMdemo/2DWindTunnel/files.
You can introduce streams of either smoke in air or sulfur hexafluoride
smoke, which will enter the wind tunnel at the left and help to visualize
the flow, just like the people who made those beautiful pictures in
An Album of Fluid Motion.
Give it a try.
At the worst it will only crash your PC.
(Be warned that this application does not run properly on Windows ME.)
[This software is provided with no assurance of its value in any
respect. By downloading it, you agree not to distribute it and not to
complain in any way about any effect or side effect of your use of this
software. To run the software, you must download the .exe file and the
associated DLLs that are on the above referenced Web site. You must
have an Intel Pentium-III processor or better or equivalent to run this
software. And watch out for that sulfur hexafuoride smoke. When it
comes down the duct at the same speed as Mach 2 air, it hits the
step in the duct at Mach 5! That can be a bit traumatic, as you can
see in the image here. Maybe you are best advised to just stick to
smoke in air. It's not real sulfur hexafluoride anyway -- just a gamma-law
gas with a gamma of 1.09 and 4.88 times the density of air when at the
same pressure and temperature. Enjoy. Oh, by the way, the multifluid
aspect of this program is under development. So if it doesn't work for
you, don't worry. It won't work for us either, so we'll fix it eventually
and you need not send any E-mail to anyone about how it ruined your day
by hanging, burning up your processor, or any other thing. Remember,
you agreed not to complain. So don't.]
Play with a 2-D Version of the PPM Gas Dynamics Code
on your own Windows PC.
A 2-D version of the LCSE's PPM gas dynamics code can be downloaded from this
Web site that will run a standard fluid dynamics test problem on your own PC.
You might encounter a bug or two in the functioning of the window's controls,
but this program has been run by University of Minnesota freshman successfully.
If they can do it, you can too.
Compressible fluid dynamics fans will recognize this test problem as the one
first introduced by Emery in 1967.
This is an updated version, with lots more interest than the original, so our
freshmen would not get bored.
Read about an earlier version of this program (we think it is backwards
compatible and are too lazy to update the documentation) in the LCSE Wind
Tunnel Experimenter's User Guide at
www.lcse.umn.edu/PPMdemo/2DWindTunnel/files.
You can introduce streams of either smoke in air or sulfur hexafluoride
smoke, which will enter the wind tunnel at the left and help to visualize
the flow, just like the people who made those beautiful pictures in
An Album of Fluid Motion.
Give it a try.
At the worst it will only crash your PC.
(Be warned that this application does not run properly on Windows ME.)
[This software is provided with no assurance of its value in any
respect. By downloading it, you agree not to distribute it and not to
complain in any way about any effect or side effect of your use of this
software. To run the software, you must download the .exe file and the
associated DLLs that are on the above referenced Web site. You must
have an Intel Pentium-III processor or better or equivalent to run this
software. And watch out for that sulfur hexafuoride smoke. When it
comes down the duct at the same speed as Mach 2 air, it hits the
step in the duct at Mach 5! That can be a bit traumatic, as you can
see in the image here. Maybe you are best advised to just stick to
smoke in air. It's not real sulfur hexafluoride anyway -- just a gamma-law
gas with a gamma of 1.09 and 4.88 times the density of air when at the
same pressure and temperature. Enjoy. Oh, by the way, the multifluid
aspect of this program is under development. So if it doesn't work for
you, don't worry. It won't work for us either, so we'll fix it eventually
and you need not send any E-mail to anyone about how it ruined your day
by hanging, burning up your processor, or any other thing. Remember,
you agreed not to complain. So don't.]